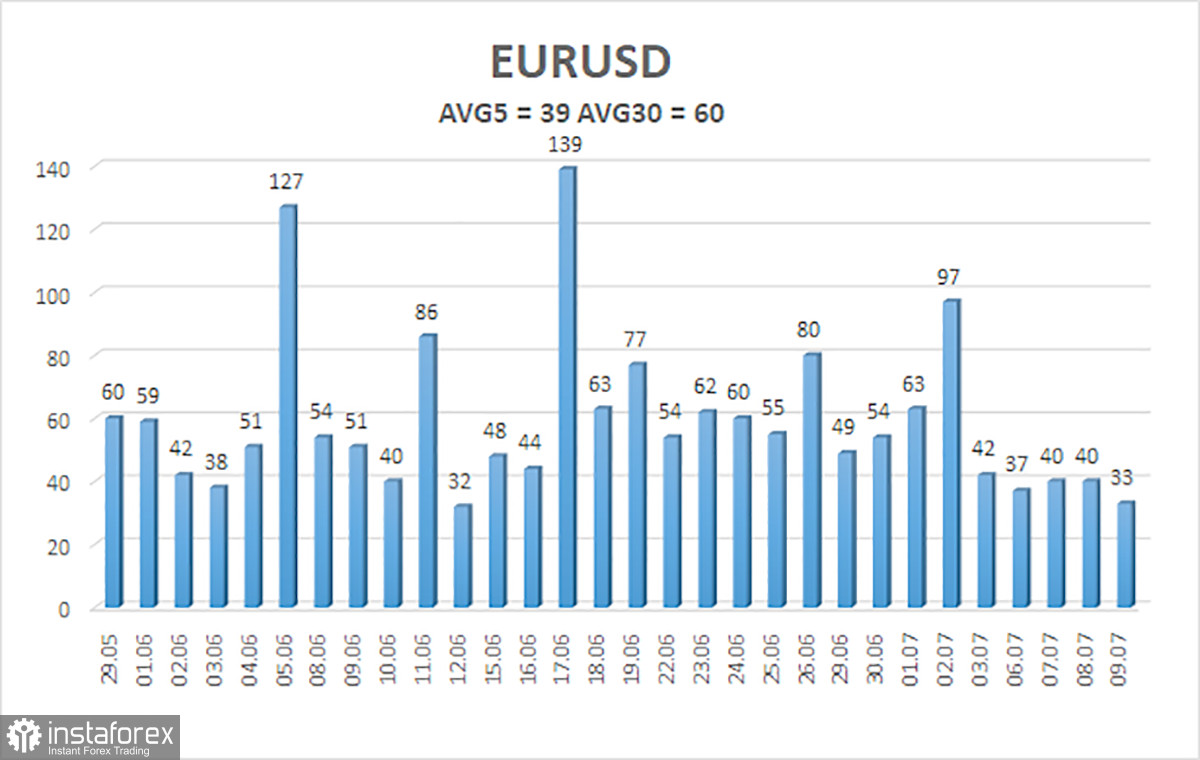
The EUR/USD currency pair once again failed to impress with its movements on Thursday. The illustration below clearly shows that since last Friday, the pair has struggled to move more than 40 pips in a day. What further confirmation is needed to demonstrate that the market is ignoring incoming news? It should be noted that there have been very few important events this week. Among the economic releases, the ISM Services PMI for the US might be highlighted; however, the index matched expectations, so there was no reaction. The Federal Reserve minutes is always a formal event that simply cannot surprise traders. Geopolitics? The market has long ignored it as it has grown weary of the "swings" between Donald Trump and Iran.
In principle, we won't even analyze all the geopolitical events from this week. Iran has struck American military bases, the US has retaliated, and the Strait of Hormuz continues to be in a state of confusion—it seems open, but a missile could strike your vessel at any moment if you deviate from the course or fail to coordinate passage with Tehran. The strait cannot be called safe and free. Donald Trump continues to threaten Iran with further strikes and the destruction of all infrastructure, pretending to be the most invested in the current situation regarding the deal with Tehran. Tehran, knowing the ball is in its court, continues to manipulate the United States, throwing tantrums like a little girl, seeking the best possible terms for the agreement. But as soon as Trump sees new demands from Tehran, he promptly orders its destruction. A couple of days later, "Qatari representatives" convince the American president of the need to continue negotiations, and everything starts over. The market is no longer responding to this "Santa Barbara".
Thus, there is essentially nothing to analyze this week. There were no important events, no market movements, and no volatility. The only option left is to revisit higher timeframes and attempt to understand the global technical picture. The weekly timeframe shows that since 2022, the EUR/USD pair has been in an upward trend, with no signs of its completion. Notably, in 2022, the euro rose sharply by 1,500 points, then remained flat for over a year, followed by a pullback and a new surge of 1,500 points upward. Now, we have been observing a flat for a year, and the latest rise of the US dollar raises many unanswered questions. We consider it completely illogical. A new upward trend, in our opinion, will be entirely justified. Therefore, despite the recent decline in the pair over the past two months, we still expect only long-term growth for the euro. The lower the euro drops now, the stronger it will rise later.
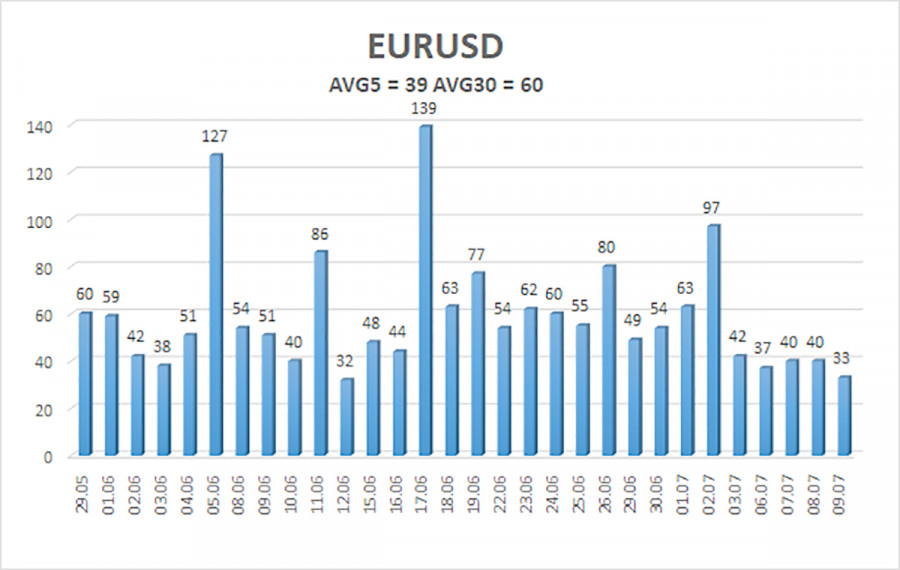
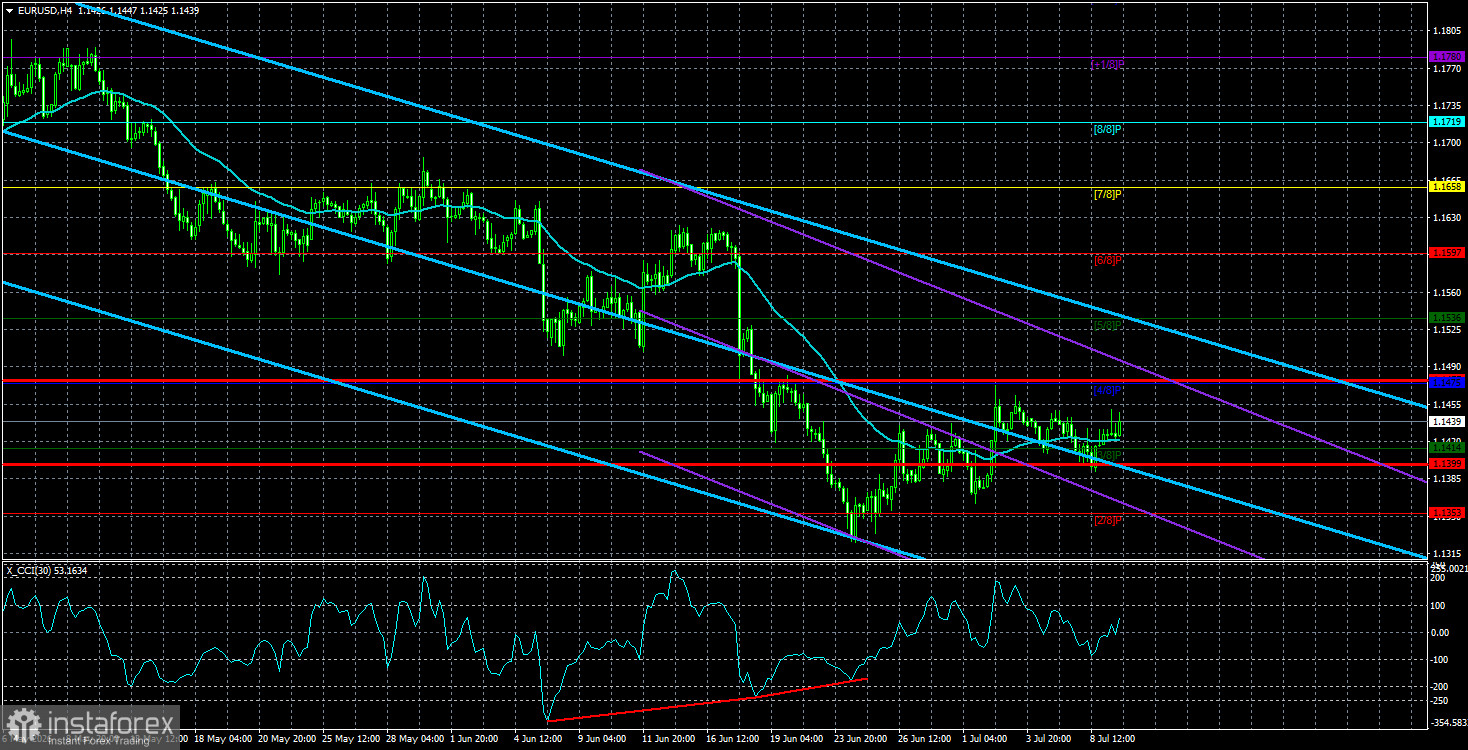
The average volatility of the EUR/USD pair over the last 5 trading days, as of July 10, is 39 pips, which is considered "low." We expect the pair to move between 1.1399 and 1.1477 on Friday. The upper channel of the linear regression has turned downward, indicating the continuation of the downward trend. The CCI indicator has entered the oversold area and has formed two "bullish" divergences, which warn of a possible end to the downward trend.
Nearest support levels:
S1 – 1.1414
S2 – 1.1353
S3 – 1.1292
Nearest resistance levels:
R1 – 1.1475
R2 – 1.1536
R3 – 1.1597
Trading Recommendations:
The EUR/USD pair maintains a downward trend, which is presumably a correction within a broader upward trend, as seen on daily or weekly timeframes. The overall fundamental backdrop for the dollar remains negative, but in 2026, geopolitical tensions followed by the Fed's hawkish stance have provided substantial support to the US currency. When the price is below the moving average, short positions can be considered with targets of 1.1353 and 1.1292. Above the moving average line, long positions are relevant with targets of 1.1475 and 1.1536. Bears are currently exceptionally strong for no visible reason.
Explanations for Illustrations:
- Linear regression channels help determine the current trend. If both are directed the same way, it indicates a strong trend.
- The moving average line (settings 20,0, smoothed) determines the short-term trend and direction in which trading should be conducted;
- Murray levels are target levels for movements and corrections;
- Volatility levels (red lines) represent the probable price channel within which the pair will move in the coming day, based on current volatility statistics;
- The CCI indicator entering the oversold area (below -250) or the overbought area (above +250) indicates that a trend reversal in the opposite direction is approaching.