The EUR/USD currency pair traded higher on Tuesday, suggesting the range has resumed. How is this possible if the pair left a three-week sideways channel on Friday? It is possible, but with some nuances that should be understood. Three weeks ago, the European currency was trading in a range against the dollar, and traders stopped reacting not only to macroeconomic fundamentals but even to geopolitics. In other words, the market found itself under the following conditions. Geopolitics is recognized as the most significant factor determining market sentiment by 90%, but the market is also ready to react to events rather than to mere rumors, promises, and inside information. Since no globally significant events have occurred during this time, traders have found no reason to buy or sell.
Then came Friday, and the mega-important, highly publicized Nonfarm Payrolls report. The pair plummeted more than 100 pips, yet the market's attitude toward macroeconomics, fundamentals, and geopolitics did not change. The market still shows little interest in any economic events, and there are virtually no geopolitical events. Therefore, after Friday's decline, we now observe an increase, which most experts attribute to a rise in market risk sentiment. Of course, since Donald Trump promised for the 37th time to end the war and sign a deal with Iran...
During Trump's first term in office, statistical agencies and portals started counting how many times per day the U.S. president made false statements. Over his four-year presidency, it was estimated that Trump averaged 14.7 false statements per day. We pointed this out to traders last year, when the market repeatedly reacted to the American president's promises or threats. Later, the TACO principle emerged, which essentially means the same thing but in a different wrapper—Trump constantly promises and then "backs down."
Yesterday, he claimed for the 37th time that "a deal with Iran is imminent and could be signed very soon." 37 times in two months. Essentially, Trump is making the same promise every two days. Therefore, we do not consider the fall of the American currency on Tuesday to be in any way connected to Trump's promises to end the war in the Middle East. The market can stumble upon the same rake twice or even five times. But 37 times is too much.
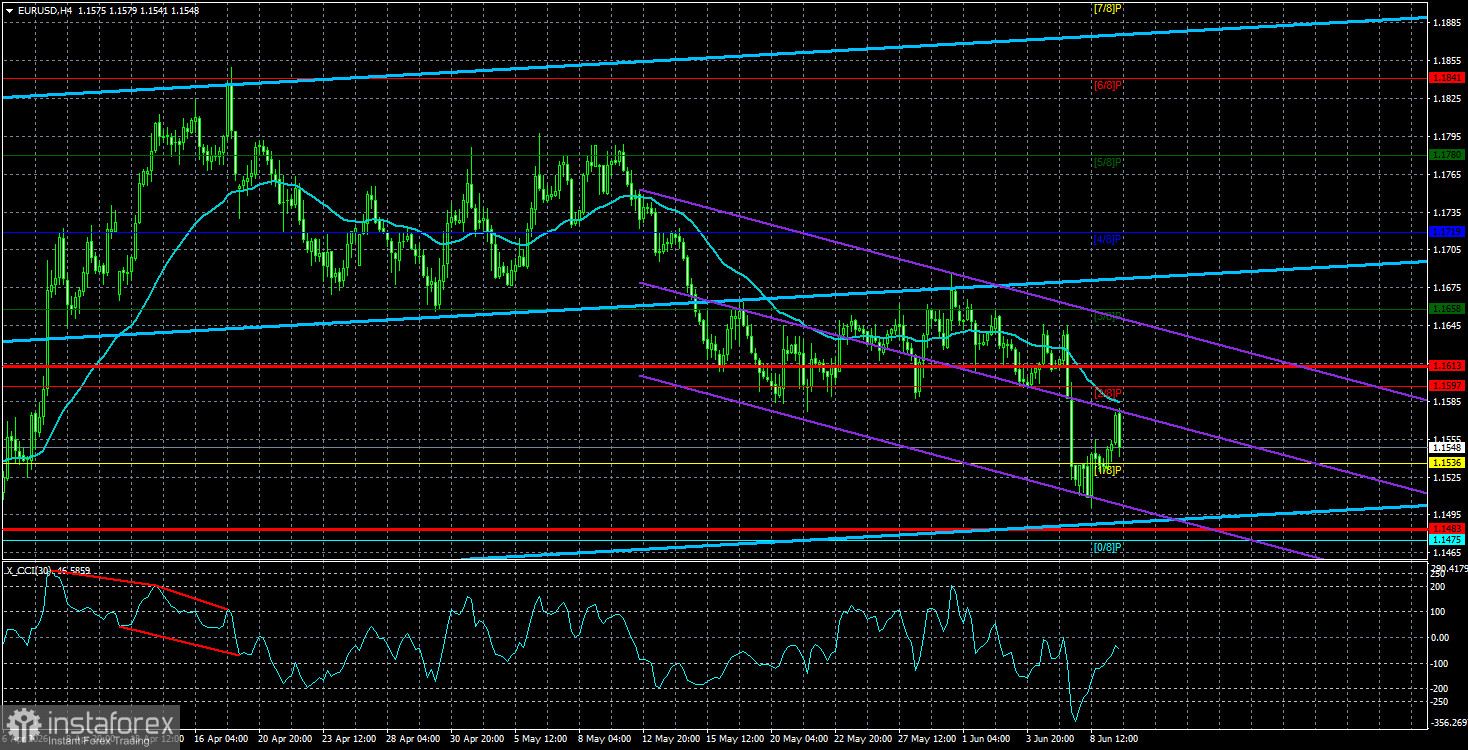
What we saw on Tuesday was a return of quotes to a convenient price range. That is, back into the sideways channel of 1.1597-1.1658. In the last two months, the American currency has strengthened well, but its long-term prospects have not changed. The dollar can only rely on a resumption of war in the Middle East, which we hope to avoid.
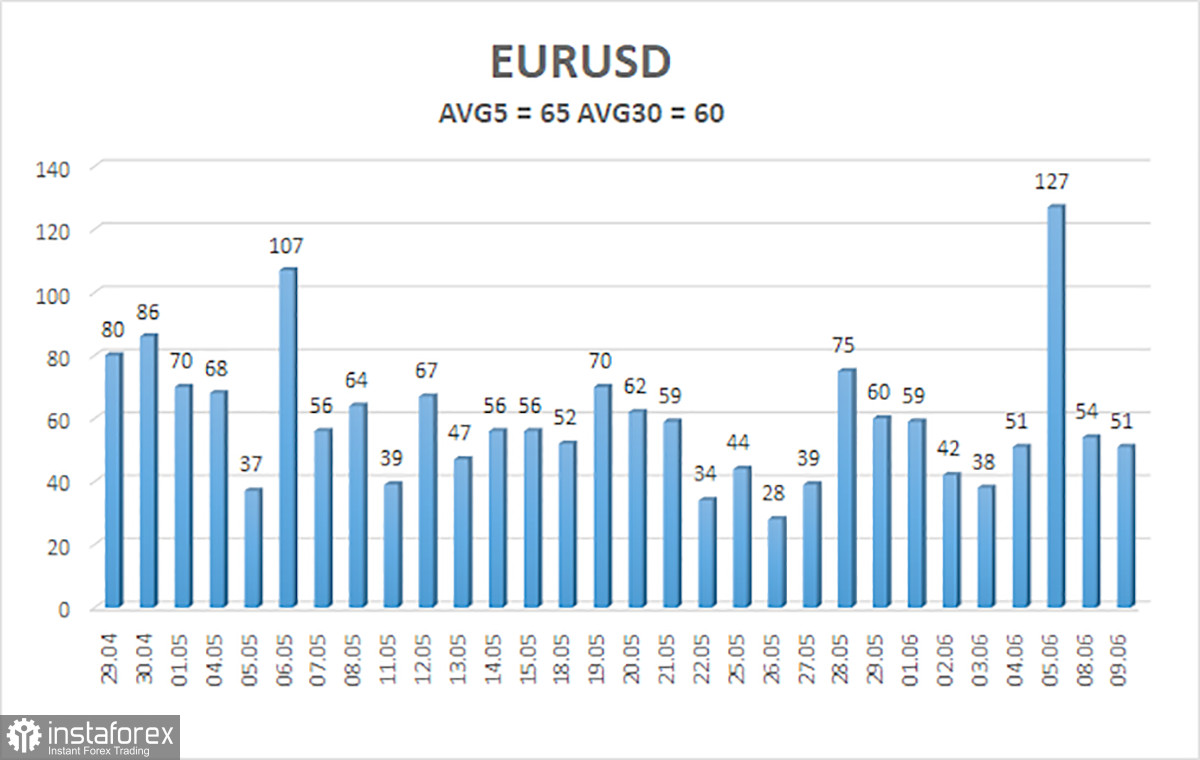
The average volatility of the EUR/USD currency pair over the last five trading days as of June 10 is 65 pips, which is considered "average." We expect the pair to move within a range bounded by levels 1.1483 and 1.1613 on Wednesday. The upper channel of the linear regression has turned upward, indicating a trend change to bullish. The CCI indicator has entered the overbought area and formed two "bearish" divergences, warning of the onset of a downward correction that is still not complete. On Friday, it entered the oversold area, signaling a possible end to the correction.
Nearest Support Levels:
S1 – 1.1536
S2 – 1.1475
S3 – 1.1414
Nearest Resistance Levels:
R1 – 1.1597
R2 – 1.1658
R3 – 1.1719
Trading Recommendations:
The EUR/USD pair continues its downward movement, presumably a correction within the context of a global upward trend. The global fundamental backdrop for the dollar remains extremely negative, and only the geopolitical factor regularly supports it. If the price is below the moving average, short positions may be considered with targets at 1.1483 and 1.1475. Above the moving average line, long positions are relevant with targets at 1.1719 and 1.1780. The market continues to move away from geopolitical factors, but in recent weeks the dollar has been in demand as hopes for peace in the Middle East have weakened.
Explanations for Illustrations:
Linear regression channels help determine the current trend. If both are directed in the same direction, the trend is strong;
The moving average line (settings 20,0, smoothed) determines the short-term trend and the direction in which trading should be conducted;
Murray levels are target levels for movements and corrections;
Volatility levels (red lines) indicate the prospective price channel within which the pair will likely remain for the next 24 hours, based on current volatility indicators;
The CCI indicator entering the oversold zone (below -250) or the overbought zone (above +250) indicates that a trend reversal in the opposite direction is near.