Top.Mail.Ru
empty
06.06.2025 11:09 AM
Forecast for EUR/USD on June 6, 2025

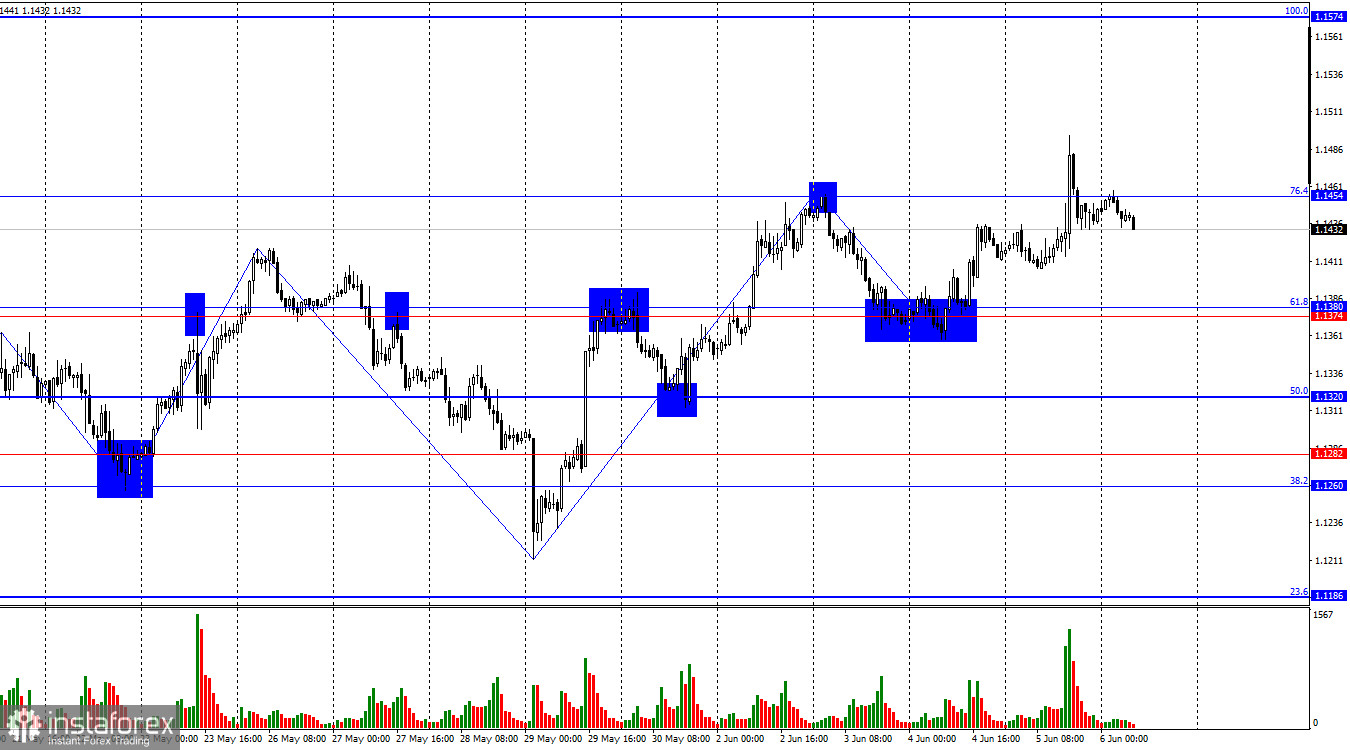
On Thursday, the EUR/USD pair continued its upward movement but made two rebounds from the 76.4% corrective level at 1.1454, suggesting a potential reversal in favor of the U.S. dollar and some decline toward the support zone at 1.1374–1.1380. A consolidation above 1.1454 would increase the likelihood of further growth toward the next Fibonacci correction level at 1.1574.

This image is no longer relevant

The wave situation on the hourly chart remains clear. The last completed downward wave did not break the previous low, while the last upward wave broke the previous high. Thus, the trend remains "bullish" for now. Recent news about a possible increase in tariffs on steel and aluminum has once again forced the bears to retreat.

The news background on Thursday offered certain opportunities for the bears, but they failed to take advantage. The ECB held another meeting in 2025, and almost unanimously decided to lower interest rates by 0.25%. This was the eighth decision to ease monetary policy. Thus, the bears had a chance to go on the offensive, but this time traders were dissatisfied with the tone of Christine Lagarde, who stated at the press conference that policy easing is likely complete or close to completion. Effectively, Lagarde did not "close the door" to future rate cuts but noted that inflation has returned to target levels and the current rate level is appropriate. Therefore, in the future, the regulator may decide on further easing, but it will depend on economic data. If the data reflects a decline in inflation below the target level, rates may be cut again. Traders likely expected 1–2 more rounds of easing, but this reason for the euro's rise looks more like an excuse. In fact, the market continues to sell off the U.S. dollar for quite understandable reasons, and the ECB meeting was merely a trigger for traders on Thursday.

This image is no longer relevant

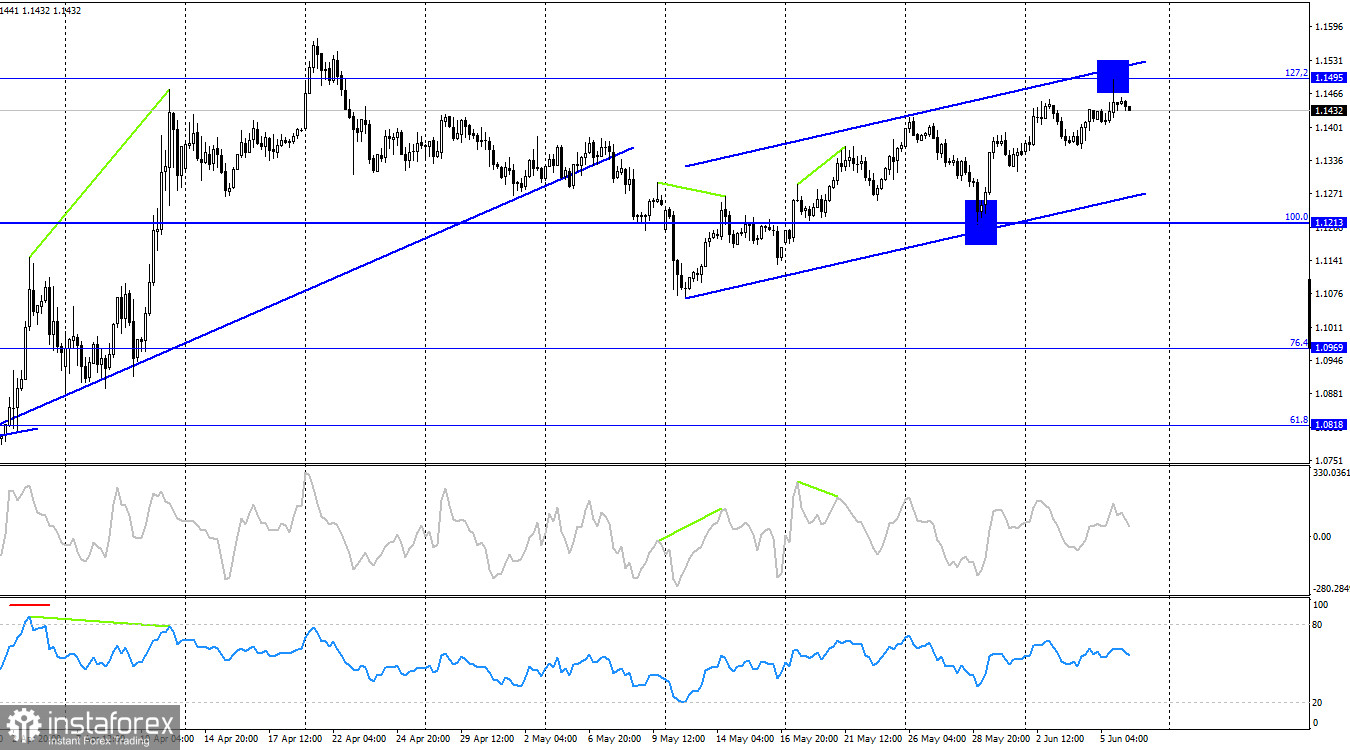
On the 4-hour chart, the pair rose toward the 127.2% Fibonacci corrective level at 1.1495. A rebound from this level would favor the U.S. dollar and some decline toward the 100.0% Fibonacci level at 1.1213. A consolidation above 1.1495 would increase the likelihood of continued growth toward the 161.8% Fibonacci level at 1.1851. No divergences are forming on any indicator. The trend channel still signals the continuation of the "bullish" trend.

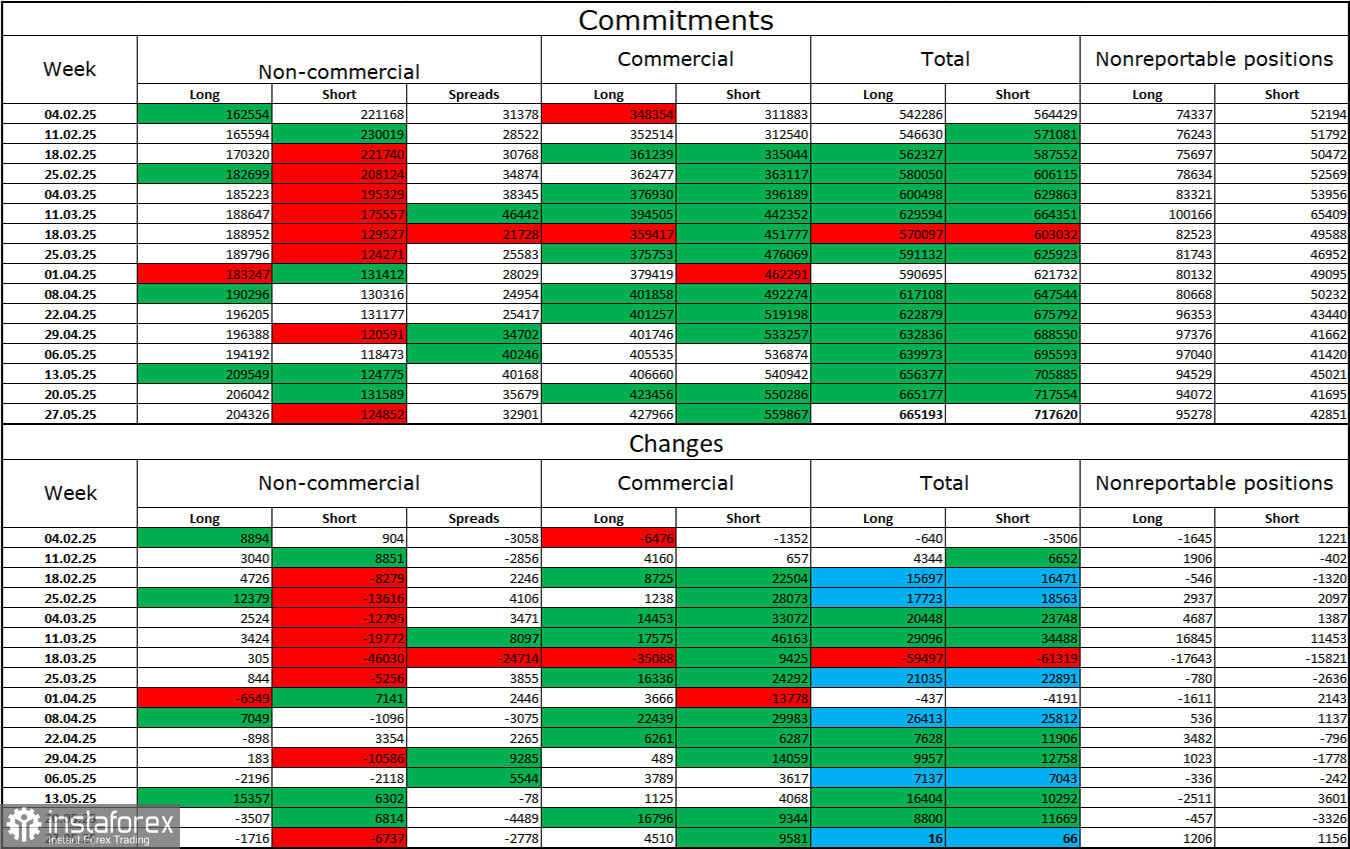
Commitments of Traders (COT) Report:

This image is no longer relevant

During the last reporting week, professional traders closed 1,716 long positions and 6,737 short positions. The sentiment of the "Non-commercial" group remains "bullish" thanks to Donald Trump. The total number of long positions held by speculators now stands at 204,000, while short positions stand at 124,000, and the gap (with rare exceptions) continues to widen. Thus, the euro remains in demand, while the dollar does not. The situation remains unchanged.

For seventeen consecutive weeks, large traders have been reducing their short positions and increasing their long positions. The difference in monetary policy approaches between the ECB and the Fed is skewed in favor of an expanding rate differential, which still supports the U.S. dollar, but Donald Trump's policies remain a stronger factor for traders, as they could lead to a recession in the U.S. economy and many other long-term structural issues.

News Calendar for the U.S. and the Eurozone:

  • Eurozone – Germany Industrial Production Change (06:00 UTC)
  • Eurozone – Retail Sales Change (09:00 UTC)
  • Eurozone – GDP Change for Q1 (09:00 UTC)
  • U.S. – Nonfarm Payrolls Change (12:30 UTC)
  • U.S. – Unemployment Rate (12:30 UTC)
  • U.S. – Average Hourly Earnings Change (12:30 UTC)

On June 6, the economic events calendar includes quite a few important entries. Particular attention will be paid to the U.S. labor market and unemployment reports. The influence of the news background on market sentiment could be strong on Friday.

EUR/USD Forecast and Trading Tips:

Sales of the pair were possible on a rebound from the 1.1454 level with targets at 1.1374–1.1380 and 1.1320. I recommended buying on a rebound from the 1.1320 level on the hourly chart with a target at 1.1374–1.1380. This target has been reached. New purchases are possible if the pair consolidates above the 1.1374–1.1380 zone with a target at 1.1454 or on a new rebound from the 1.1374–1.1380 zone.

Fibonacci grids are built between 1.1574–1.1066 on the hourly chart and 1.1214–1.0179 on the 4-hour chart.

Samir Klishi,
Analytical expert of InstaForex
© 2007-2025
Summary
Urgency
Analytic
Grigory Sokolov
Start trade
Earn on cryptocurrency rate changes with InstaForex
Download MetaTrader 4 and open your first trade
  • Grand Choice
    Contest by
    InstaForex
    InstaForex always strives to help you
    fulfill your biggest dreams.
    JOIN CONTEST

Recommended Stories

Forex forecast 28/07/2025: EUR/USD, USD/JPY, GBP/USD, Gold, Ethereum and Bitcoin

Useful links: My other articles are available in this section InstaForex course for beginners Popular Analytics Open trading account Important: The begginers in forex trading need to be very careful

Sebastian Seliga 11:32 2025-07-28 UTC+2

EUR/USD. Analysis and Forecast

At the start of the new week during the Asian session, the EUR/USD pair attempted to remain positive, but during the European session, prices fell below the 1.1750 level amid

Irina Yanina 11:13 2025-07-28 UTC+2

EUR/USD – July 28th: The EU and U.S. Reach an Agreement

On Friday, the EUR/USD pair returned to the 127.2% retracement level at 1.1712 and rebounded from it. This suggests that the upward movement may continue toward the next level

Samir Klishi 10:58 2025-07-28 UTC+2

GBP/USD – July 28th: The U.S. and China Reach an Agreement as Well

On the hourly chart, the GBP/USD pair continued its decline on Friday toward the 1.3425 level after closing below the 76.4% retracement level at 1.3470. Today, a firm move below

Samir Klishi 10:40 2025-07-28 UTC+2

With today's Golden Cross on USD/CAD, the Loonie has the potential to strengthen and rise to its nearest resistance level on Monday, July 28, 2025.

USD/CAD – Monday, July 28, 2025 Although the RSI (14) is at a neutral-bearish level, the Golden Cross condition between the 50-EMA and 200-EMA indicates a bullish bias, so USD/CAD

Arief Makmur 08:07 2025-07-28 UTC+2

Fiber has the potential to weaken today, with the Pivot level potentially being broken, Monday, July 28, 2025.

EUR/USD – Monday, July 28, 2025. With the appearance of a divergence between Fiber's price movement and the RSI(14) indicator, although the 50 and 200 EMAs (Golden Cross & RSI(14)

Arief Makmur 08:07 2025-07-28 UTC+2

Trading Signals for EUR/USD for July 28-30, 2025: sell below 1.1780 (21 SMA - 8/8 Murray)

Early in the American session, the euro is trading around 1.1752, bouncing back after finding good support around 1.1718. Last week, the euro sharply broke out of the uptrend channel

Dimitrios Zappas 06:43 2025-07-28 UTC+2

Trading Signals for BITCOIN for July 28-30, 2025: sell below $119,800 (200 EMA - 21 SMA)

Bitcoin is in a correction phase after recently reaching $19,750. BTC is undergoing a technical correction, so the price is likely to drop in the coming hours toward the 21SMA

Dimitrios Zappas 06:41 2025-07-28 UTC+2

Trading Signals for GOLD for July 28-30, 2025: buy above $3,320 (200 EMA - 5/8 Murray)

Early in the European session, gold is trading around 3,331, bouncing back after reaching the key support zone around the 5/8 Murray level. Gold could recover some of its losses

Dimitrios Zappas 06:39 2025-07-28 UTC+2

EUR/USD Forecast for July 28, 2025

The euro is currently being supported from below by the daily MACD indicator line. If the price lacks the strength to break through resistance and move toward the target

Laurie Bailey 04:52 2025-07-28 UTC+2
Can't speak right now?
Ask your question in the chat.
Widget callback
 

Dear visitor,

Your IP address shows that you are currently located in the USA. If you are a resident of the United States, you are prohibited from using the services of InstaFintech Group including online trading, online transfers, deposit/withdrawal of funds, etc.

If you think you are seeing this message by mistake and your location is not the US, kindly proceed to the website. Otherwise, you must leave the website in order to comply with government restrictions.

Why does your IP address show your location as the USA?

  • - you are using a VPN provided by a hosting company based in the United States;
  • - your IP does not have proper WHOIS records;
  • - an error occurred in the WHOIS geolocation database.

Please confirm whether you are a US resident or not by clicking the relevant button below. If you choose the wrong option, being a US resident, you will not be able to open an account with InstaForex anyway.

We are sorry for any inconvenience caused by this message.