Top.Mail.Ru
empty
10.03.2025 11:29 AM
The Beginning of the End for U.S. Funds?

This image is no longer relevant

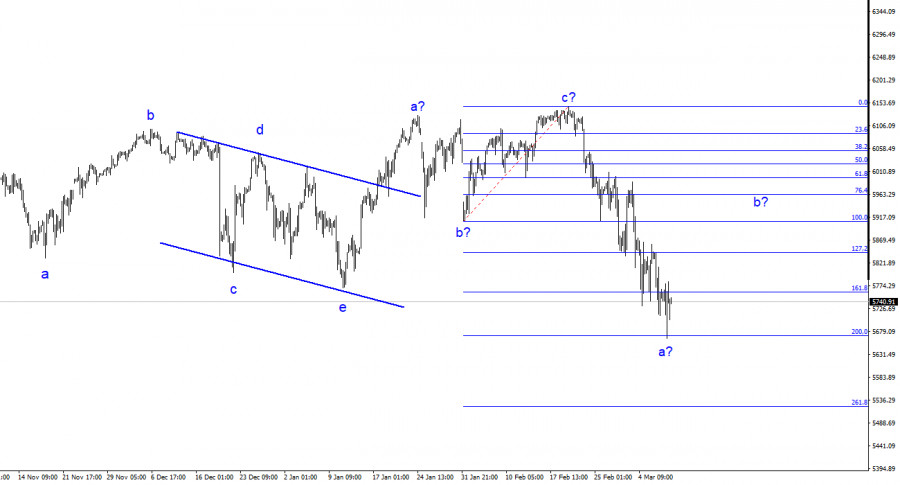
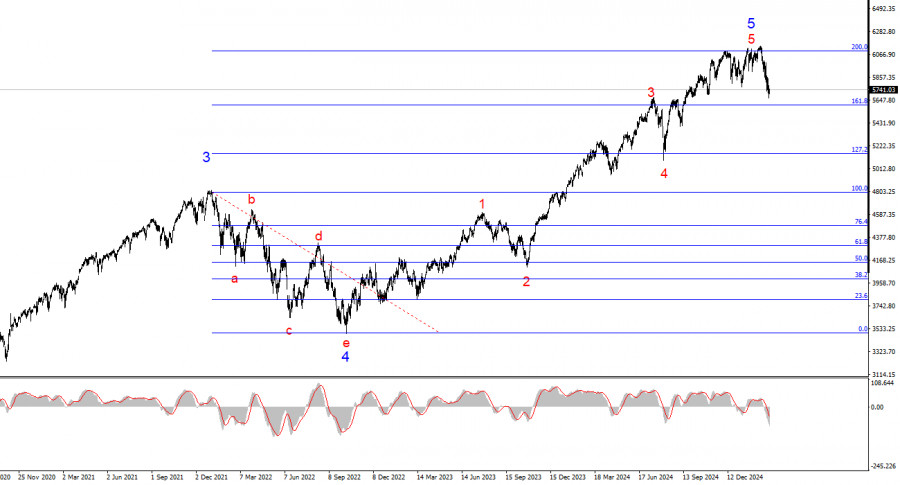
The wave structure on the 4-hour chart for the S&P 500 (#SPX) appears somewhat ambiguous, but overall, the pattern is clear. Looking at the 24-hour chart, the primary takeaway is the presence of a long-term five-wave structure that extends far beyond the visible terminal window at minimum scale. In simpler terms, U.S. stock indices have been in an uptrend for an extended period. As we know, trends alternate, and it appears that wave 5 in 5 has now completed.

The S&P 500 attempted to break above the 6,093 level four times, aligning with the 200.0% Fibonacci extension from wave 4, but failed on each occasion. Given these developments, a corrective wave cycle is likely on the horizon. The U.S. stock market is overheated, and an increasing number of experts are discussing the possibility of a bubble.

Shifting to the 4-hour chart, a completed a-b-c-d-e complex corrective structure is visible, followed by an upward a-b-c formation. Consequently, a new bearish wave structure appears to be forming, with the first wave resembling an impulse wave. Based on this, I anticipate a short-term upward wave (wave 2 or b), after which a renewed downtrend is expected. Another upward impulse may occur, but this could be followed by a more significant decline in the index. My current approach is to focus on the daily chart's structure, which suggests a prolonged downturn in the S&P 500.

The S&P 500 failed to sustain its uptrend, lacking both technical wave-based and fundamental justifications. In recent weeks, U.S. stock indices have been consistently declining, not only due to the policies of the new U.S. president but also because the countries targeted by Trump's tariffs are preparing retaliatory measures. As a result, American manufacturers will also face restrictions, leading to lower sales, reduced revenue, and weaker profitability. What should investors do in this situation?

Another critical factor is the growing global movement away from U.S. goods due to Trump's protectionist policies. This suggests that even without additional tariffs on American exports, demand for U.S. products is already declining. Trump has achieved something remarkable—he has incentivized half the world to reject American goods. This naturally raises the question: What does this mean for U.S. companies?

This image is no longer relevant

Key Takeaways

Based on my analysis of the S&P 500 (#SPX), I conclude that the index has completed its upward trend. Given the 6,125 level and Trump's economic policies, my bias remains bearish. The president's trade wars, tariffs, and import duties are destabilizing the U.S. economy and American businesses, making a downtrend increasingly likely. The U.S. stock market bubble appears to have reached its limit.

  • The 4-hour chart suggests one last potential upward push, followed by a renewed decline.
  • The 24-hour chart indicates the formation of a longer-term bearish trend.
  • The broader wave structure remains clear, showing a well-defined five-wave cycle, with wave five potentially nearing its completion.
  • If this wave structure holds, a prolonged and complex correction may have already begun.

Core Principles of My Analysis:

  1. Wave structures should be simple and clear. Complex patterns are difficult to trade and often change unexpectedly.
  2. If there is uncertainty about the market direction, it is better to stay out.
  3. There is never 100% certainty in market movements. Always use protective Stop Loss orders.
  4. Wave analysis can be combined with other forms of technical analysis and trading strategies.
Chin Zhao,
Analytical expert of InstaForex
© 2007-2025
Summary
Urgency
Analytic
Alexander Dneprovskiy
Start trade
Earn on cryptocurrency rate changes with InstaForex
Download MetaTrader 4 and open your first trade
  • Chancy Deposit
    Deposit your account with $3,000 and get $3000 more!
    In September we raffle $3000 within the Chancy Deposit campaign!
    Get a chance to win by depositing $3,000 to a trading account. Having fulfilled this condition, you become a campaign participant.
    JOIN CONTEST

Recommended Stories

Stock market on September 22: S&P 500 and Nasdaq continue to set new highs

Last Friday, US equity indices closed higher, with the S&P 500 up 0.49% and the Nasdaq 100 gaining 0.72%. The Dow Jones Industrial Average rose 0.47%. Asian indices moved higher

Jakub Novak 11:18 2025-09-22 UTC+2

US stock market: rate cut opens door to new record highs

The US stock market has entered a new phase following the Federal Reserve's first rate cut of the year. The decision to lower the federal funds rate by 25 basis

Anna Zotova 15:46 2025-09-18 UTC+2

Stock Market on September 18: S&P 500 and Nasdaq regain losses amid Fed' decision

US stock indices closed mixed at the end of yesterday's session. The S&P 500 fell by 0.10%, while the Nasdaq 100 declined by 0.43%. The Dow Jones Industrial Average, however

Jakub Novak 11:53 2025-09-18 UTC+2

Stock Market on September 17: S&P 500 and Nasdaq return to earth

US equity indices closed lower yesterday, with the S&P 500 down 0.13% and the Nasdaq 100 slipping 0.07%. The Dow Jones Industrial Average fell 0.27%. Futures on major indices

Jakub Novak 10:39 2025-09-17 UTC+2

S&P 500 Forecast for September 17, 2025

A month ago, on August 19, we expected a US stock market reversal based on the completion of five DeMark sequences. However, that reversal didn't materialize—there was only a five-day

Laurie Bailey 08:15 2025-09-17 UTC+2

Stock Market on September 16: S&P 500 and NASDAQ set new all-time highs

US equity indices closed higher yesterday, with the S&P 500 up 0.47% and the Nasdaq 100 adding 0.44%. The Dow Jones Industrial Average gained 0.11%. Indices continued to notch record

Jakub Novak 11:23 2025-09-16 UTC+2

Stock Market on September 15: S&P 500 and NASDAQ remain near record highs

Last Friday, US equity indices closed mixed. The S&P 500 edged down 0.05%, while the Nasdaq 100 gained 0.49%. The Dow Jones Industrial Average slipped 0.49%. At the start

Jakub Novak 10:44 2025-09-15 UTC+2

Stock market on September 12: S&P 500 and NASDAQ set new all-time highs

Yesterday, US stock indices closed higher. The S&P 500 rose by 0.85%, while the Nasdaq 100 added 0.72%. The Dow Jones Industrial Average fell by 1.36%. Relatively moderate inflation readings

Jakub Novak 09:26 2025-09-12 UTC+2

Stock market on September 11: S&P 500 and NASDAQ ease slightly ahead of key data

Yesterday, US stock indices closed mixed. The S&P 500 rose by 0.30%, while the Nasdaq 100 added 0.03%. The industrial Dow Jones fell by 0.48%. Futures on US and European

Jakub Novak 08:42 2025-09-11 UTC+2

Stock market on September 10: S&P 500 and NASDAQ hit new record highs

Yesterday, US stock indices closed higher. The S&P 500 rose by 0.27%, while the Nasdaq 100 gained 0.37%. The industrial Dow Jones strengthened by 0.43%. The indices reached record highs

Jakub Novak 08:46 2025-09-10 UTC+2
Can't speak right now?
Ask your question in the chat.
Widget callback
 

Dear visitor,

Your IP address shows that you are currently located in the USA. If you are a resident of the United States, you are prohibited from using the services of InstaFintech Group including online trading, online transfers, deposit/withdrawal of funds, etc.

If you think you are seeing this message by mistake and your location is not the US, kindly proceed to the website. Otherwise, you must leave the website in order to comply with government restrictions.

Why does your IP address show your location as the USA?

  • - you are using a VPN provided by a hosting company based in the United States;
  • - your IP does not have proper WHOIS records;
  • - an error occurred in the WHOIS geolocation database.

Please confirm whether you are a US resident or not by clicking the relevant button below. If you choose the wrong option, being a US resident, you will not be able to open an account with InstaForex anyway.

We are sorry for any inconvenience caused by this message.