Top.Mail.Ru
empty
04.11.2024 06:26 AM
Technical Analysis of Intraday Price Movement of CAD/JPY Cross Currency Pairs, Monday November 04, 2024.

This image is no longer relevant

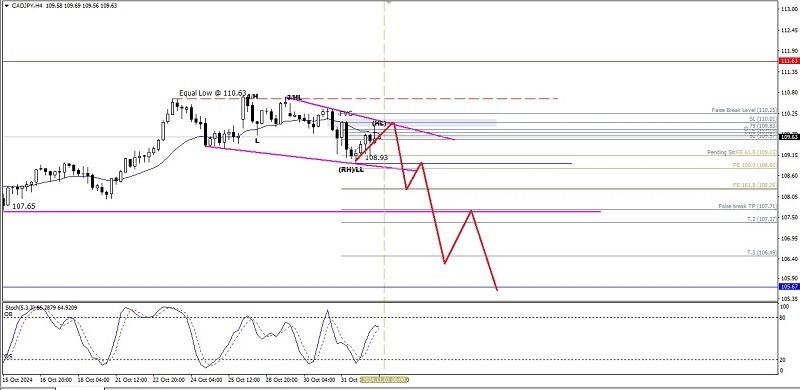
From what is seen on the 4-hour chart, the CAD/JPY cross currency pair appears to be under seller pressure, which is confirmed by its price movement below the EMA 21 which has a slope that dives down and the formation of a Bearish 123 pattern followed by the appearance of a Bearish Ross Hook (RH) coupled with its price action forming a higher-Low and Lower Low so that based on these facts in the near future CAD/JPY has the potential to test the 109.13 level if this level is successfully broken and lost below it, then CAD/JPY has the potential to continue its weakening to the 108.80 level as its main target and 108.26 as the next target if volatility and momentum support it, but if on its way to the target levels there is a sudden strengthening correction to CAD/JPY, especially if it penetrates and closes above the 110.36 level, then the weakening scenario that has been described will be invalid and canceled by itself.

(Disclaimer)

Summary
Urgency
Analytic
Arief Makmur
Start trade
Earn on cryptocurrency rate changes with InstaForex
Download MetaTrader 4 and open your first trade
  • Grand Choice
    Contest by
    InstaForex
    InstaForex always strives to help you
    fulfill your biggest dreams.
    JOIN CONTEST

Recommended Stories

EUR/USD Forecast on November 6, 2025

The EUR/USD pair came to a halt on Wednesday. For more than a week, the euro had been falling, but on Wednesday the decline stopped — and no upward movement

Samir Klishi 10:47 2025-11-06 UTC+2

GBP/USD Forecast on November 6, 2025

On the hourly chart, the GBP/USD pair on Wednesday rebounded from the 200.0% Fibonacci correction level at 1.3024, turned in favor of the British pound, and began to rise toward

Samir Klishi 09:55 2025-11-06 UTC+2

GBP/USD. Technical Analysis on November 6, 2025

On Wednesday, the pair moved upward to the 185.4% level at 1.3057 (red dotted line), closing the daily candle at 1.3046. Today, the price may continue moving upward. On Thursday

Stefan Doll 09:37 2025-11-06 UTC+2

EUR/USD. Technical Analysis on November 6, 2025

On Wednesday, the pair moved downward, with support at 1.1472 (blue dotted line), then turned upward, closing the daily candle at 1.1491. Today, the price may continue moving upward

Stefan Doll 09:28 2025-11-06 UTC+2

Trading Signals for GOLD (XAU/USD) for November 6-8, 2025: buy above $3,961 (200 EMA - 7/8 Murray)

Gold is trading around $3,984 within the descending trend channel formed on October 22nd and above the 200 EMA and the 21 SMA, suggesting the possibility of an upward move

Dimitrios Zappas 05:32 2025-11-06 UTC+2

Trading Signals for BITCOIN for November 6-8, 2025: buy above $100,000 (21 SMA - 1/8 Murray)

We believe that Bitcoin could reach $106,250 around the 2/8 Murray level in the coming days, and a break above this zone could lead to a move towards the psychological

Dimitrios Zappas 05:30 2025-11-06 UTC+2

Trading Signals for EUR/USD for November 6-8, 2025: buy above 1.1474 (21 SMA - 6/8 Murray)

Let me remind you that the euro left a gap around 1.1740 in October, so we believe that the euro could resume its upward cycle in the coming days

Dimitrios Zappas 05:27 2025-11-06 UTC+2

USD/JPY. Analysis, Forecast, and Current Market Situation

From a technical perspective, the breakout of the resistance level at 153.25–153.30 last week and the subsequent move above the key round level of 154.00 were viewed as a major

Irina Yanina 20:39 2025-11-05 UTC+2

GBP/USD. Technical Analysis on November 5, 2025

On Tuesday, the pair moved downward to the 208% level at 1.3006 (red dotted line), then reversed upward, closing the daily candle at 1.3017. Today, it may start an upward

Stefan Doll 10:58 2025-11-05 UTC+2

EUR/USD. Technical Analysis on November 5, 2025

On Tuesday, the pair moved downward, breaking through the support level at 1.1472 (blue dotted line), and then rose, closing the daily candle at 1.1481. Today, it may begin

Stefan Doll 10:57 2025-11-05 UTC+2
Can't speak right now?
Ask your question in the chat.
Widget callback
 

Dear visitor,

Your IP address shows that you are currently located in the USA. If you are a resident of the United States, you are prohibited from using the services of InstaFintech Group including online trading, online transfers, deposit/withdrawal of funds, etc.

If you think you are seeing this message by mistake and your location is not the US, kindly proceed to the website. Otherwise, you must leave the website in order to comply with government restrictions.

Why does your IP address show your location as the USA?

  • - you are using a VPN provided by a hosting company based in the United States;
  • - your IP does not have proper WHOIS records;
  • - an error occurred in the WHOIS geolocation database.

Please confirm whether you are a US resident or not by clicking the relevant button below. If you choose the wrong option, being a US resident, you will not be able to open an account with InstaForex anyway.

We are sorry for any inconvenience caused by this message.