

Actual patterns
Patterns are graphical models which are formed in the chart by the price. According to one of the technical analysis postulates, history (price movement) repeats itself. It means that the price movements are often similar in the same situations which makes it possible to predict the further development of the situation with a high probability.
Actual Patterns
- All
- Double Top
- Flag
- Head and Shoulders
- Pennant
- Rectangle
- Triangle
- Triple top
- All
- #AAPL
- #AMZN
- #Bitcoin
- #EBAY
- #FB
- #GOOG
- #INTC
- #KO
- #MA
- #MCD
- #MSFT
- #NTDOY
- #PEP
- #TSLA
- #TWTR
- AUDCAD
- AUDCHF
- AUDJPY
- AUDUSD
- EURCAD
- EURCHF
- EURGBP
- EURJPY
- EURNZD
- EURRUB
- EURUSD
- GBPAUD
- GBPCHF
- GBPJPY
- GBPUSD
- GOLD
- NZDCAD
- NZDCHF
- NZDJPY
- NZDUSD
- SILVER
- USDCAD
- USDCHF
- USDJPY
- USDRUB
- All
- M5
- M15
- M30
- H1
- D1
- All
- Buy
- Sale
- All
- 1
- 2
- 3
- 4
- 5
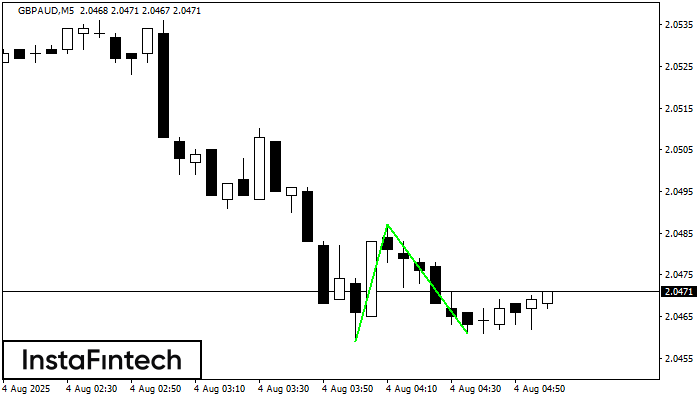
The Double Bottom pattern has been formed on GBPAUD M5. This formation signals a reversal of the trend from downwards to upwards. The signal is that a buy trade should
The M5 and M15 time frames may have more false entry points.
Open chart in a new window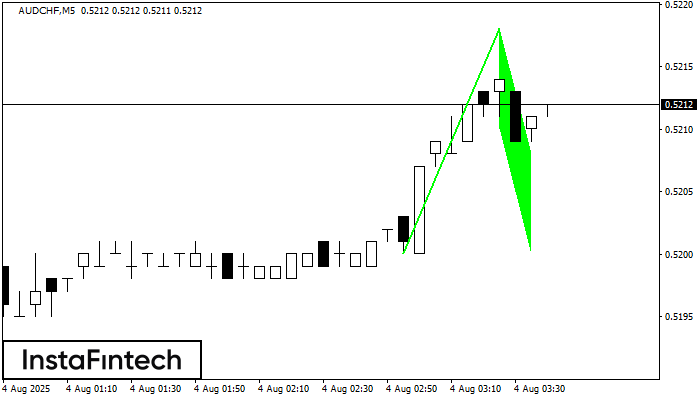
The Bullish Flag pattern has been formed on AUDCHF at M5. The lower boundary of the pattern is located at 0.5210/0.5200, while the higher boundary lies at 0.5218/0.5208. The projection
The M5 and M15 time frames may have more false entry points.
Open chart in a new window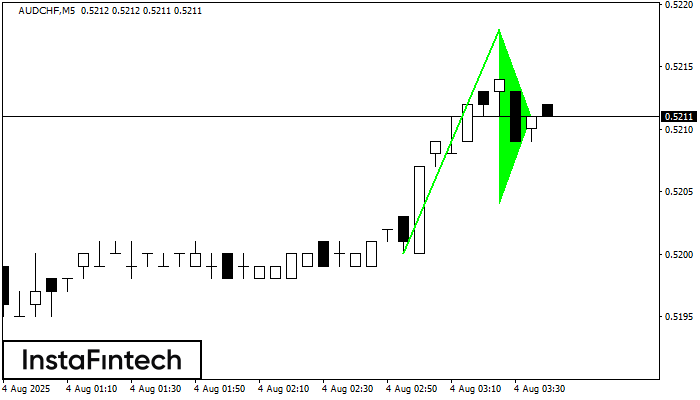
The Bullish pennant signal – Trading instrument AUDCHF M5, continuation pattern. Forecast: it is possible to set up a buy position above the pattern’s high of 0.5218, with the prospect
The M5 and M15 time frames may have more false entry points.
Open chart in a new window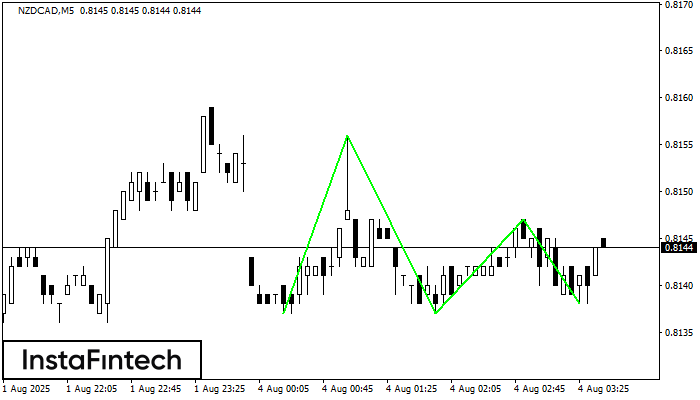
The Triple Bottom pattern has formed on the chart of the NZDCAD M5 trading instrument. The pattern signals a change in the trend from downwards to upwards in the case
The M5 and M15 time frames may have more false entry points.
Open chart in a new window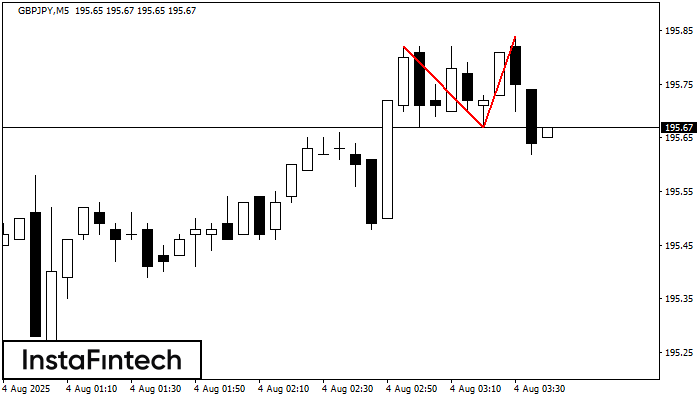
The Double Top reversal pattern has been formed on GBPJPY M5. Characteristics: the upper boundary 195.82; the lower boundary 195.67; the width of the pattern is 17 points. Sell trades
The M5 and M15 time frames may have more false entry points.
Open chart in a new window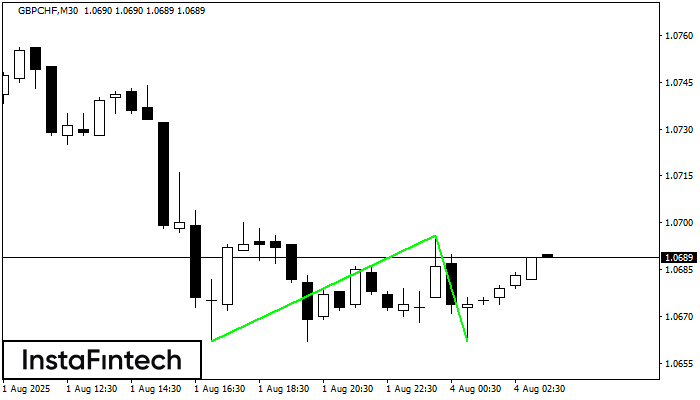
The Double Bottom pattern has been formed on GBPCHF M30. Characteristics: the support level 1.0662; the resistance level 1.0696; the width of the pattern 34 points. If the resistance level
Open chart in a new window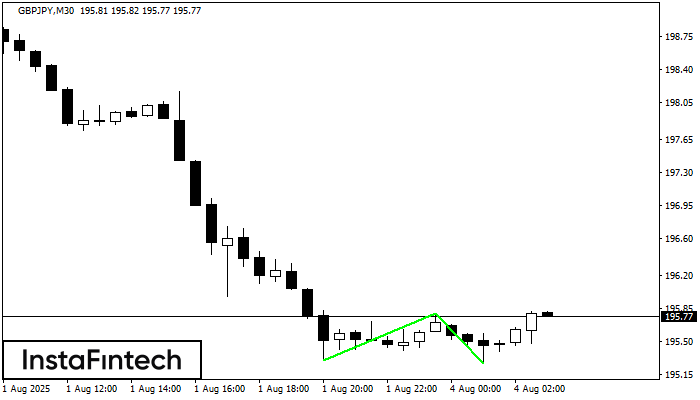
The Double Bottom pattern has been formed on GBPJPY M30. Characteristics: the support level 195.30; the resistance level 195.80; the width of the pattern 50 points. If the resistance level
Open chart in a new window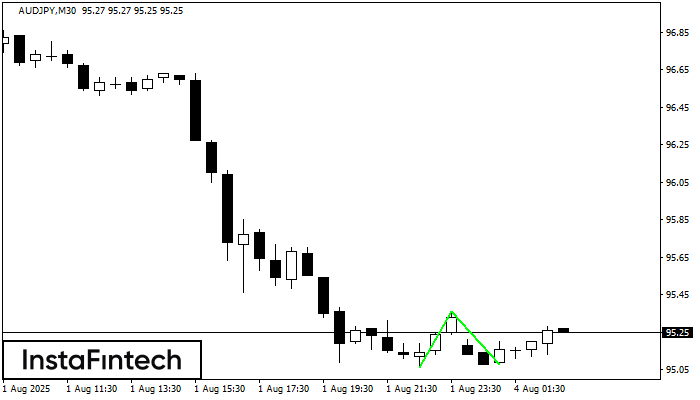
The Double Bottom pattern has been formed on AUDJPY M30. Characteristics: the support level 95.06; the resistance level 95.36; the width of the pattern 30 points. If the resistance level
Open chart in a new window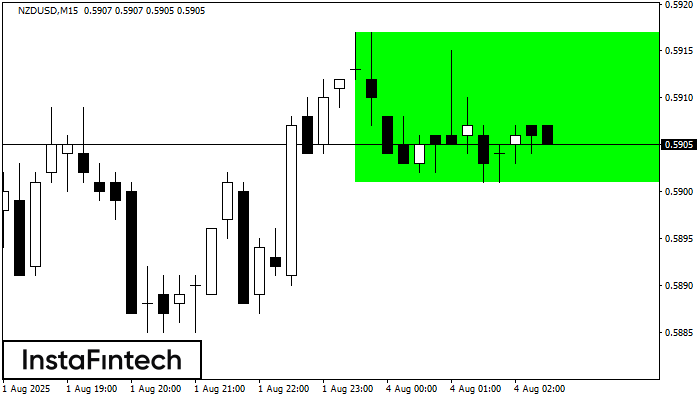
According to the chart of M15, NZDUSD formed the Bullish Rectangle which is a pattern of a trend continuation. The pattern is contained within the following borders: the lower border
The M5 and M15 time frames may have more false entry points.
Open chart in a new window


