Top.Mail.Ru
empty
03.07.2025 03:34 PM
GBP/USD: Trading Plan for the U.S. Session on July 3rd (Review of Morning Trades)

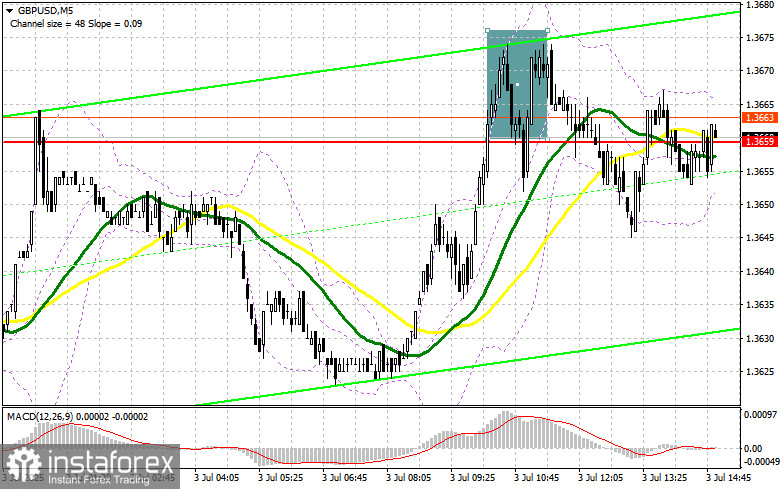
In my morning forecast, I focused on the 1.3659 level and planned to make trading decisions based on it. Let's look at the 5-minute chart and review what happened. The price rose and formed a false breakout around 1.3659, providing a good entry point for selling the pound, but after a 15-point decline, demand returned. The technical outlook was revised for the second half of the day.

This image is no longer relevant

To open long positions on GBP/USD:

The British pound rose in the first half of the day on the back of a solid UK services PMI reading. However, further movement will depend on key U.S. labor market data, including non-farm employment change, unemployment rate, and average hourly earnings. The ISM services PMI and composite PMI for June will also be released later today.

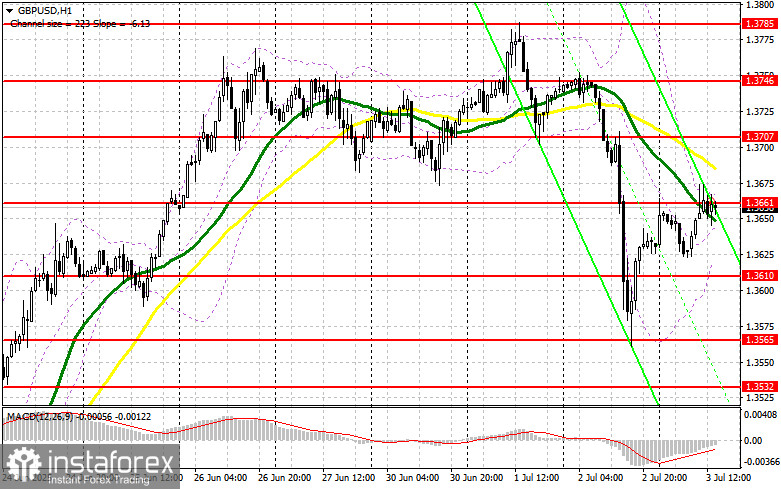
If the U.S. data is strong, pressure on the pound will likely return. In that case, I plan to buy only near major support at 1.3610. A false breakout at this level will provide a good long entry point with a target of returning to the 1.3661 resistance, where trading is currently concentrated. A breakout and retest of this range from above on weak U.S. data will offer another buying opportunity, targeting 1.3707. The final target will be the 1.3746 level, where I plan to take profit.

If GBP/USD declines and there is no bullish activity around 1.3610 in the second half of the day, pressure on the pound may increase significantly. In this case, I will only buy on a false breakout near 1.3565. Alternatively, I plan to open long positions on a rebound from the 1.3532 support, targeting a 30–35 point intraday correction.

To open short positions on GBP/USD:

Sellers have taken a wait-and-see approach after yesterday's sell-off, as all attention now turns to the U.S. labor market data. The key task remains defending resistance at 1.3661, where trading is currently taking place. A false breakout after the data release will signal a short entry with a target of a decline toward the 1.3610 support.

A breakout and retest of this area from below will trigger stop-loss orders and open the path toward 1.3565. The final target will be the 1.3532 level, where I plan to take profit.

If demand for the pound returns in the second half of the day and bears do not act around 1.3661—just above where the moving averages are currently located, supporting the bearish outlook—GBP/USD could see a larger upward move. In that case, I will delay short entries until the 1.3707 resistance is tested, and only sell there on a false breakout. If there is no reversal at that level either, I'll look for short entries on a bounce near 1.3746, targeting a 30–35 point downward correction.

This image is no longer relevant

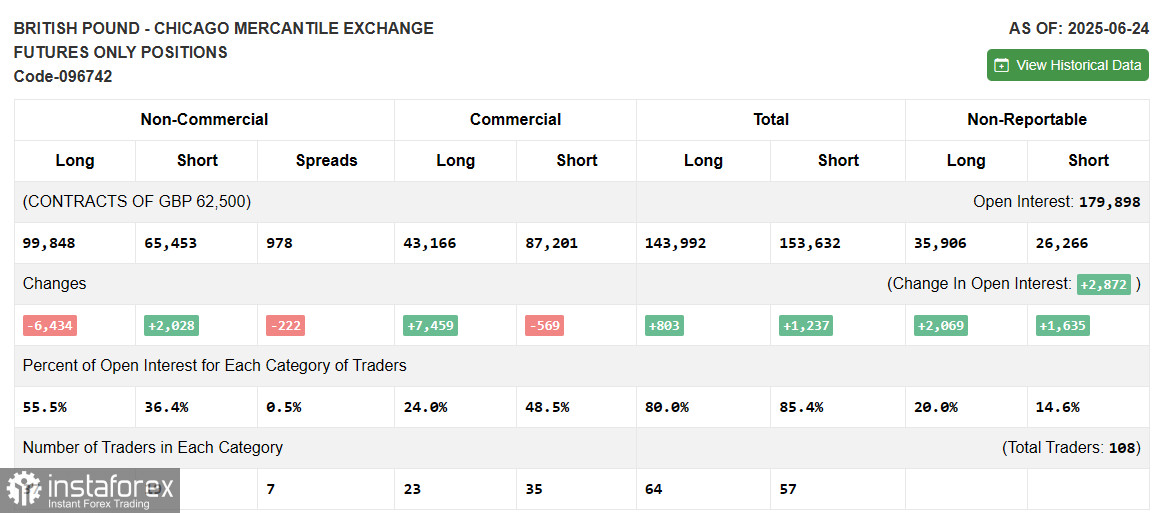
Commitment of Traders (COT) Report (June 24):

The latest COT report showed an increase in short positions and a reduction in long ones. The British pound continues to show solid bullish momentum, supported by recent UK GDP and inflation data. The fact that the U.S. Federal Reserve may cut interest rates earlier than previously expected is already weighing on the U.S. dollar.

Upcoming U.S. labor market reports will determine the next direction for GBP/USD. According to the latest COT report, long non-commercial positions decreased by 6,434 to 99,848, while short non-commercial positions rose by 2,028 to 65,453. As a result, the net long position narrowed by 222.

This image is no longer relevant

Indicator Signals:

Moving AveragesTrading is occurring below the 30- and 50-period moving averages, indicating potential downward pressure.

Note: The author uses the H1 chart to analyze moving averages, which differs from the classic daily (D1) chart approach.

Bollinger BandsIf the price declines, the lower Bollinger Band around 1.3625 will act as support.

Indicator Descriptions:

  • Moving Average (MA): Smooths out volatility and noise to indicate the current trend.
    • 50-period (yellow line)
    • 30-period (green line)
  • MACD (Moving Average Convergence/Divergence):
    • Fast EMA: 12-period
    • Slow EMA: 26-period
    • Signal line (SMA): 9-period
  • Bollinger Bands:
    • Period: 20
  • Non-commercial traders: Speculators such as individual traders, hedge funds, and large institutions using the futures market for speculative purposes.
  • Long non-commercial positions: The total long open interest held by non-commercial traders.
  • Short non-commercial positions: The total short open interest held by non-commercial traders.
  • Net non-commercial position: The difference between short and long positions held by non-commercial traders.
Miroslaw Bawulski,
Analytical expert of InstaForex
© 2007-2025
Summary
Urgency
Analytic
Maxim Magdalinin
Start trade
Earn on cryptocurrency rate changes with InstaForex
Download MetaTrader 4 and open your first trade
  • Grand Choice
    Contest by
    InstaForex
    InstaForex always strives to help you
    fulfill your biggest dreams.
    JOIN CONTEST

Recommended Stories

How to Trade the GBP/USD Pair on September 8? Simple Tips and Trade Analysis for Beginners

Friday Trade Review: 1H Chart of GBP/USD On Friday, the GBP/USD pair also showed a relatively strong upward movement, which was driven mainly by very weak US unemployment and labor

Paolo Greco 06:51 2025-09-08 UTC+2

How to Trade the EUR/USD Pair on September 8? Simple Tips and Trade Analysis for Beginners

Friday Trade Review: 1H Chart of EUR/USD On Friday, the EUR/USD currency pair showed a strong upward move, which fully reflected the macroeconomic background. It was impossible to predict

Paolo Greco 06:50 2025-09-08 UTC+2

Trading Recommendations and Analysis of EUR/USD Deals for September 8. The Perfect Friday

On Friday, the EUR/USD currency pair showed strong growth for understandable reasons. The NonFarm Payrolls report disappointed for the fourth time in a row, and the US unemployment rate rose

Paolo Greco 03:47 2025-09-08 UTC+2

How to Trade the GBP/USD Pair on September 5? Simple Tips and Trade Analysis for Beginners

Thursday Trade Review: 1H Chart of GBP/USD The GBP/USD pair traded in absolute flat conditions on Thursday. The day's total volatility was just 45 pips, despite the release of another

Paolo Greco 06:37 2025-09-05 UTC+2

How to Trade the EUR/USD Pair on September 5? Simple Tips and Trade Analysis for Beginners

Thursday Trade Review: 1H Chart of EUR/USD The EUR/USD currency pair continued trading inside a sideways channel on Thursday. Nothing is helping so far—not fundamental events, nor macroeconomic data releases

Paolo Greco 06:37 2025-09-05 UTC+2

Trading Recommendations and Trade Breakdown for GBP/USD on September 5. The ISM Index Gave the Dollar a Small Boost

The GBP/USD currency pair also traded very weakly on Thursday. After the British currency recovered on Wednesday, bulls were unable to break through the Ichimoku indicator lines, leading

Paolo Greco 03:32 2025-09-05 UTC+2

Trading Recommendations and Trade Breakdown for EUR/USD on September 5. Mockery of Traders

Throughout Thursday, the EUR/USD currency pair was essentially in convulsions all day. Despite the publication of lots of important reports this week, the market is simply refusing to trade

Paolo Greco 03:32 2025-09-05 UTC+2

How to Trade the GBP/USD Pair on September 4? Simple Tips and Trade Analysis for Beginners

Wednesday Trade Review: 1H Chart of GBP/USD On Wednesday, the GBP/USD pair traded higher. Recall that on Tuesday, British currency quotes plummeted sharply—a move many experts explained by the rise

Paolo Greco 06:26 2025-09-04 UTC+2

How to Trade the EUR/USD Pair on September 4? Simple Tips and Trade Analysis for Beginners

Wednesday Trade Review: 1H Chart of EUR/USD On Wednesday, the EUR/USD currency pair recovered from Tuesday's decline, just as we had warned. There were no strong reasons for the euro's

Paolo Greco 06:26 2025-09-04 UTC+2

Trading Recommendations and Trade Breakdown for EUR/USD on September 4. The Drop Ended Just as Suddenly as It Began

On Wednesday, the EUR/USD currency pair easily and simply reversed upward around the 1.1604–1.1615 area, which can be considered the approximate lower boundary of the sideways channel the pair

Paolo Greco 03:25 2025-09-04 UTC+2
Can't speak right now?
Ask your question in the chat.
Widget callback
 

Dear visitor,

Your IP address shows that you are currently located in the USA. If you are a resident of the United States, you are prohibited from using the services of InstaFintech Group including online trading, online transfers, deposit/withdrawal of funds, etc.

If you think you are seeing this message by mistake and your location is not the US, kindly proceed to the website. Otherwise, you must leave the website in order to comply with government restrictions.

Why does your IP address show your location as the USA?

  • - you are using a VPN provided by a hosting company based in the United States;
  • - your IP does not have proper WHOIS records;
  • - an error occurred in the WHOIS geolocation database.

Please confirm whether you are a US resident or not by clicking the relevant button below. If you choose the wrong option, being a US resident, you will not be able to open an account with InstaForex anyway.

We are sorry for any inconvenience caused by this message.