Top.Mail.Ru
empty
18.04.2025 03:48 AM
Trading Recommendations and Analysis for EUR/USD on April 18: The ECB Failed to Move the Market

EUR/USD 5-Minute Analysis

This image is no longer relevant

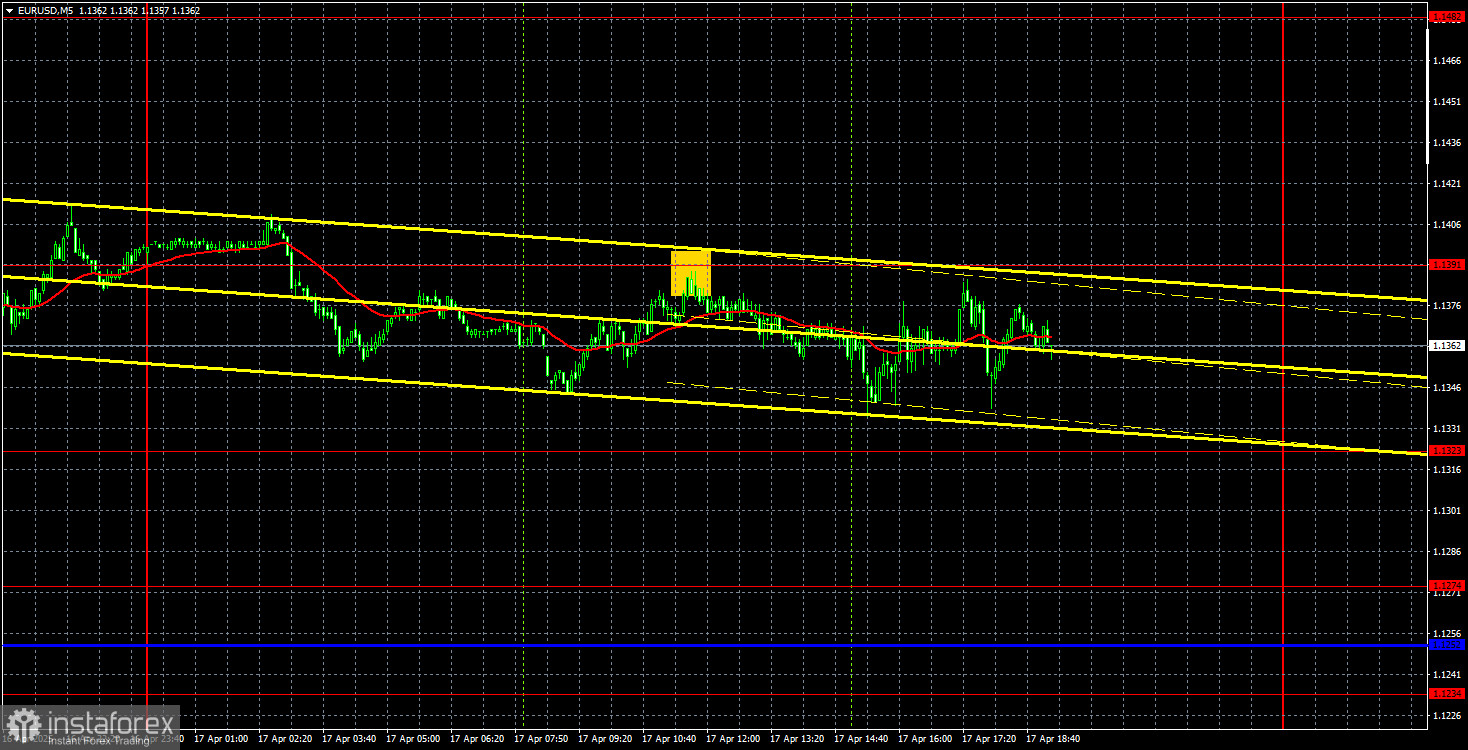
The EUR/USD currency pair continued to trade sideways on Thursday. While previously it had been moving within a range between 1.1274 and 1.1391, on Thursday, it was stuck in an absolute flat near the upper boundary of that range. The euro has been in a sideways movement for a week now, but during the European Central Bank meeting, it was precisely yesterday that the pair showed the lowest volatility and complete unwillingness to move in either direction. In our view, this once again confirms an obvious fact — the market is currently willing to trade only "on Trump." No new tariffs? No news of de-escalation? No movement.

What can we say about the technical picture at this point? On the 1H timeframe, the pair is flat, which could quickly turn into another dollar sell-off as soon as Donald Trump decides to introduce new tariffs. Unfortunately, the fate of the dollar — and many other currencies — lies in the hands of one man. When will Trump introduce new tariffs? Nobody knows. What will those tariffs look like? Also unknown. Predicting the further movement of the currency pair is simply pointless. The best one can do is attempt to trade based on technical signals — but only if they are strong and accurate.

On Thursday, one relatively strong and precise signal was formed — a rebound from the 1.1391 level with minimal deviation. After that, the price decreased to about 35 pips, though it failed to reach the nearest target. On the other hand, it also couldn't break above the 1.1391 level during the day. Therefore, exiting the short position had to be done manually — at any convenient point.

COT Report

This image is no longer relevant

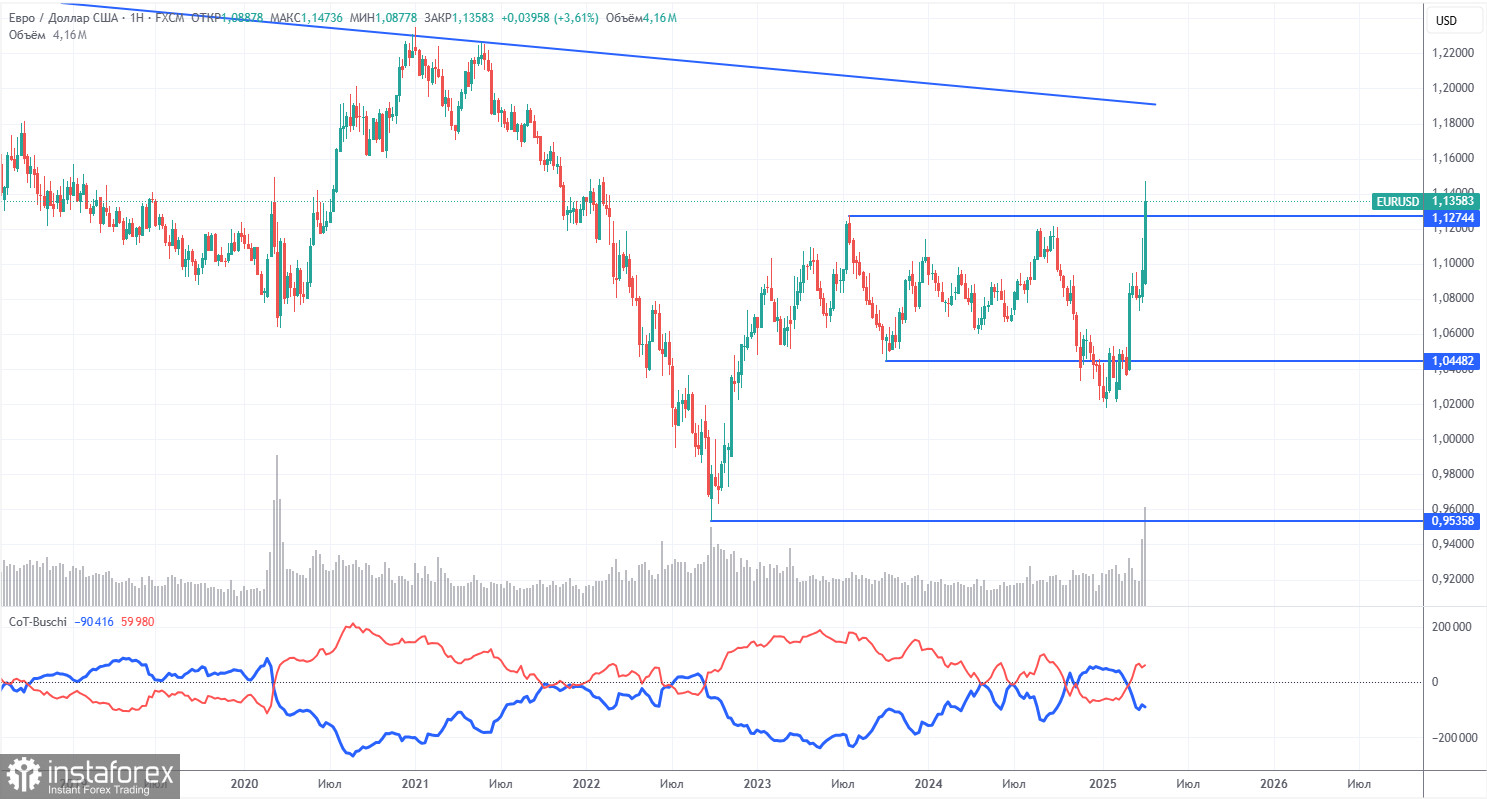
The latest COT report is dated April 8. As shown in the chart above, the net position of non-commercial traders remained in bullish territory for a long time. The bears barely managed to take control, but now bulls have regained the initiative. The bears' advantage has diminished since Trump took office, and the dollar has begun to fall.

We can't say with certainty that the dollar will continue to decline, and COT reports reflect the sentiment of large players, which can shift very quickly in the current circumstances.

We still don't see any fundamental factors supporting euro strength, but a major factor is now contributing to dollar weakness. The pair may correct for several more weeks or months, but a 16-year downward trend doesn't reverse overnight.

The red and blue lines have now crossed again, signaling a bullish trend. During the last reporting week, the number of long positions held by the "non-commercial" group increased by 7,000, while short positions dropped by 1,100—resulting in a net increase of 8,100 contracts.

EUR/USD 1-Hour Analysis

This image is no longer relevant

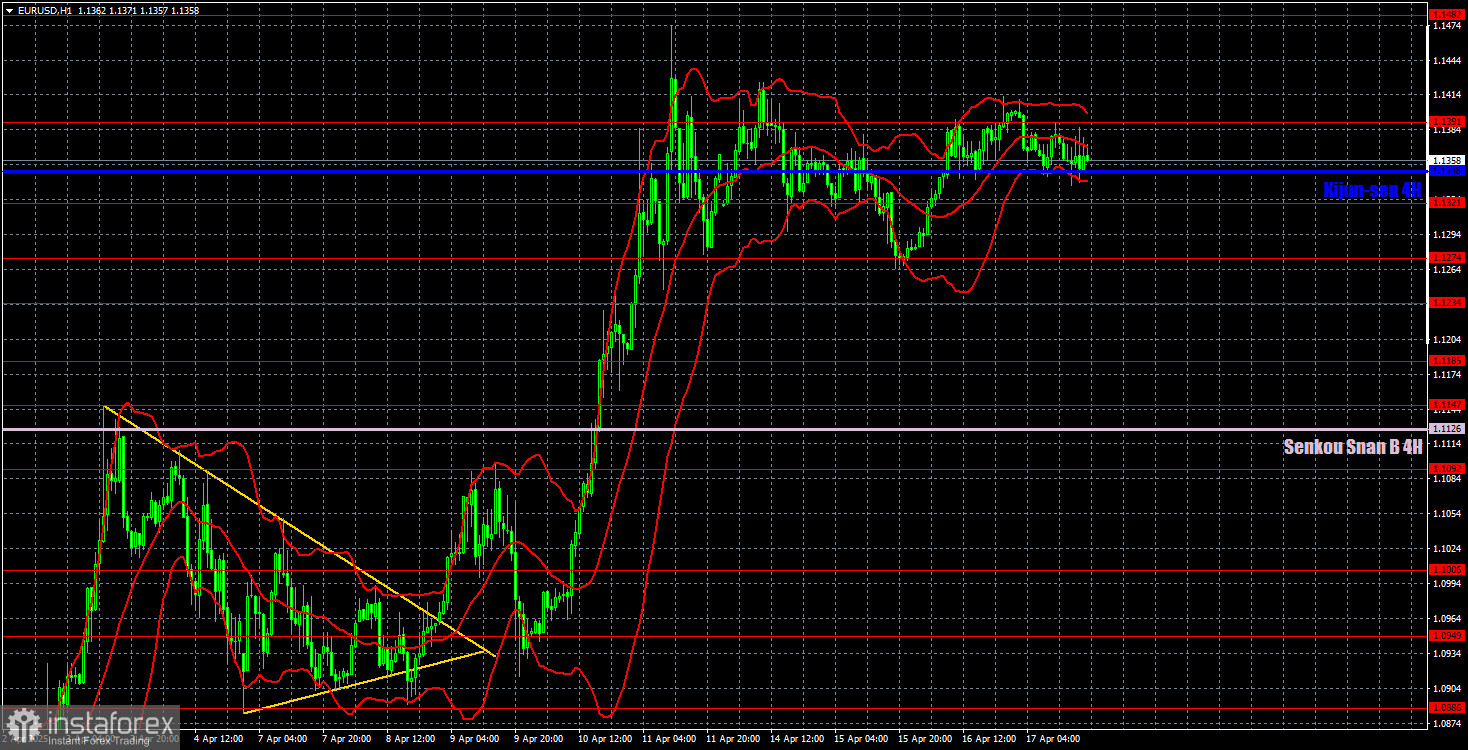
The EUR/USD pair quickly resumed its upward movement on the hourly timeframe once Trump started introducing new tariffs. Currently, the price is flat, and we are awaiting new tariffs. We can officially say the downtrend has been canceled on the daily timeframe. That would have never happened had Trump not started the trade war. Thus, the fundamental backdrop has overridden the technical picture — which doesn't happen often, but it does happen. Unfortunately, the current uptrend could end just as abruptly and unexpectedly if Trump stops implementing new tariffs and chooses the path of de-escalation.

For April 18, the following levels are highlighted for trading: 1.0757, 1.0797, 1.0823, 1.0886, 1.0949, 1.1006, 1.1092, 1.1147, 1.1185, 1.1234, 1.1274, 1.1323, 1.1391, 1.1482, as well as the Senkou Span B line (1.1126) and the Kijun-sen line (1.1348). Note that the Ichimoku indicator lines may shift throughout the day, which should be considered when identifying trading signals. Also, don't forget to set a breakeven Stop Loss order if the price moves 15 pips in the right direction — this helps prevent potential losses if the signal turns out to be false.

No significant events or reports are scheduled on Friday in the Eurozone or the U.S. However, Thursday clarified that even major events no longer guarantee market movement or reaction. The market is driven solely by news related to the trade war.

Illustration Explanations:

  • Support and Resistance Levels (thick red lines): Thick red lines indicate where movement may come to an end. Please note that these lines are not sources of trading signals.
  • Kijun-sen and Senkou Span B Lines: Ichimoku indicator lines transferred from the 4-hour timeframe to the hourly timeframe. These are strong lines.
  • Extreme Levels (thin red lines): Thin red lines where the price has previously bounced. These serve as sources of trading signals.
  • Yellow Lines: Trendlines, trend channels, or any other technical patterns.
  • Indicator 1 on COT Charts: Represents the net position size for each category of traders.
Paolo Greco,
Analytical expert of InstaForex
© 2007-2025
Summary
Urgency
Analytic
Stanislav Polyanskiy
Start trade
Earn on cryptocurrency rate changes with InstaForex
Download MetaTrader 4 and open your first trade
  • Chancy Deposit
    Deposit your account with $3,000 and get $4000 more!
    In July we raffle $4000 within the Chancy Deposit campaign!
    Get a chance to win by depositing $3,000 to a trading account. Having fulfilled this condition, you become a campaign participant.
    JOIN CONTEST

Recommended Stories

How to Trade the GBP/USD Pair on July 30? Simple Tips and Trade Analysis for Beginners

Analysis of Tuesday's Trades 1H Chart of GBP/USD On Tuesday, the GBP/USD pair also continued its downward movement, although it ended fairly quickly. The macroeconomic background was weak yesterday

Paolo Greco 06:59 2025-07-30 UTC+2

How to Trade the EUR/USD Pair on July 30? Simple Tips and Trade Analysis for Beginners

Analysis of Tuesday's Trades 1H Chart of EUR/USD On Tuesday, the EUR/USD currency pair continued its decline, although not at the same pace as on Monday. Recall that on Monday

Paolo Greco 06:59 2025-07-30 UTC+2

Trading Recommendations and Trade Breakdown for GBP/USD on July 30: The Pound Temporarily Loses Its Advantage

The GBP/USD currency pair also continued its downward movement on Tuesday, though much more moderately compared to Monday or last week. The reasons for the pound's decline this week

Paolo Greco 03:47 2025-07-30 UTC+2

Trading Recommendations and Trade Breakdown for EUR/USD on July 30: The Euro Crisis Continues

The EUR/USD currency pair continued its downward movement on Tuesday, although during the day, it made the first attempts to halt the decline and recover. Overall, we fully supported

Paolo Greco 03:47 2025-07-30 UTC+2

How to Trade the GBP/USD Pair on July 29? Simple Tips and Trade Analysis for Beginners

Analysis of Monday's Trades 1H Chart of GBP/USD The GBP/USD pair also traded lower on Monday, although the decline started much later than it did for the euro. This appears

Paolo Greco 07:06 2025-07-29 UTC+2

How to Trade the EUR/USD Pair on July 29? Simple Tips and Trade Analysis for Beginners

Analysis of Monday's Trades 1H Chart of EUR/USD The EUR/USD currency pair plunged on Monday for quite understandable, logical, and consistent reasons. Essentially, the only event

Paolo Greco 07:06 2025-07-29 UTC+2

Trading Recommendations and Trade Breakdown for GBP/USD on July 29: The Pound Didn't Expect This from von der Leyen

The GBP/USD currency pair traded more calmly on Monday. The European trading session passed entirely in a flat range, but during the U.S. session, the euro pulled the pound downward

Paolo Greco 03:44 2025-07-29 UTC+2

Trading Recommendations and Trade Breakdown for EUR/USD on July 29: The Euro Takes a Hit to Its Ambitions

On Monday, the EUR/USD currency pair was engaged in just one activity — it was falling. Over the past six months, we haven't seen many crashes in the euro

Paolo Greco 03:44 2025-07-29 UTC+2

How to Trade the GBP/USD Pair on July 28? Simple Tips and Trade Analysis for Beginners

Analysis of Friday's Trades 1H Chart of GBP/USD On Friday, the GBP/USD pair continued its decline, which began on Thursday. First, we would like to point out that the fall

Paolo Greco 07:25 2025-07-28 UTC+2

How to Trade the EUR/USD Pair on July 28? Simple Tips and Trade Analysis for Beginners

Analysis of Friday's Trades 1H Chart of EUR/USD On Friday, the EUR/USD currency pair traded with minimal decline. By the end of the day, the euro had settled below

Paolo Greco 06:18 2025-07-28 UTC+2
Can't speak right now?
Ask your question in the chat.
Widget callback
 

Dear visitor,

Your IP address shows that you are currently located in the USA. If you are a resident of the United States, you are prohibited from using the services of InstaFintech Group including online trading, online transfers, deposit/withdrawal of funds, etc.

If you think you are seeing this message by mistake and your location is not the US, kindly proceed to the website. Otherwise, you must leave the website in order to comply with government restrictions.

Why does your IP address show your location as the USA?

  • - you are using a VPN provided by a hosting company based in the United States;
  • - your IP does not have proper WHOIS records;
  • - an error occurred in the WHOIS geolocation database.

Please confirm whether you are a US resident or not by clicking the relevant button below. If you choose the wrong option, being a US resident, you will not be able to open an account with InstaForex anyway.

We are sorry for any inconvenience caused by this message.