Top.Mail.Ru
empty
11.08.2023 11:13 AM
EUR/USD and GBP/USD: Trading plan for beginner traders on August 11, 2023

Details of the economic calendar on August 10

In July, consumer prices in the United States increased by 3.2% anually. This inflationary growth was higher than the 3% in June, which was the lowest since March 2021. Nevertheless, it was expected that inflation would accelerate to 3.3%.

Core inflation in the U.S., excluding food and energy prices, slowed to 4.7% year-on-year from 4.8% in June. On a monthly basis, it was 0.2%, the same as in June.

This slight discrepancy in expectations had a positive impact on financial markets. Experts, on the whole, predict that the Federal Reserve will likely pause its interest rate hike cycle in light of the latest data.

This image is no longer relevant

Analysis of the trading charts from August 10

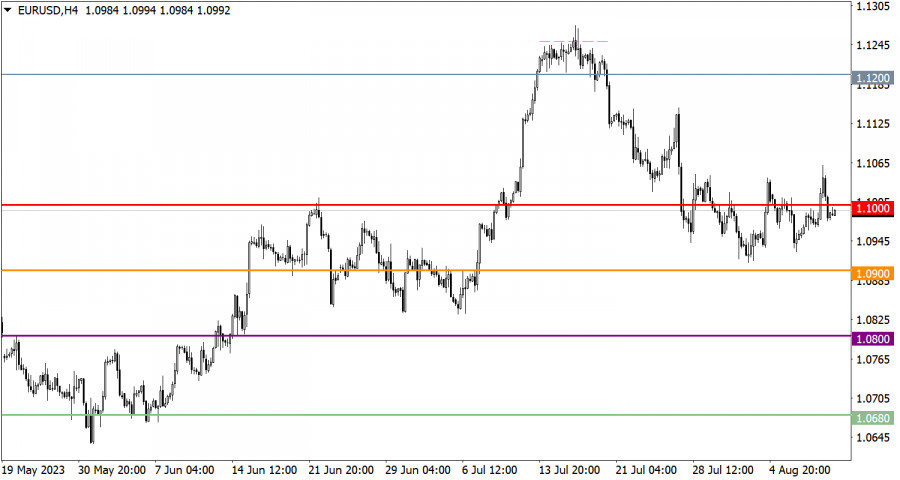
Influenced by news events, the Euro to U.S. dollar exchange rate momentarily deviated from its current range in the market. As a result of this deviation, the Euro quote briefly rose above the 1.1060 level. However, buyers couldn't maintain the price at this level, and there was a pullback, which led to a decrease in the quote below the 1.1000 mark.

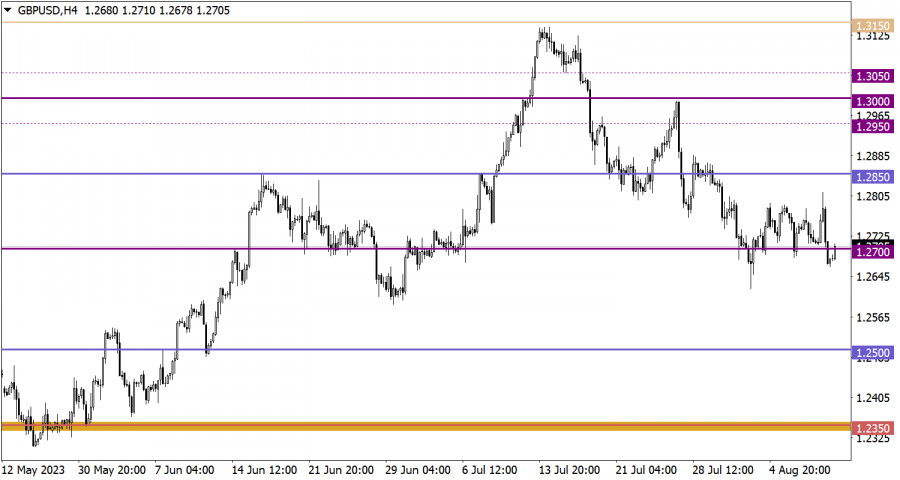
The GBP/USD currency pair showed high volatility: the quote first jumped above the 1.2800 mark, then dropped below the 1.2700 level. This bidirectional interest points to speculative activity in the market, which might be associated with recent sharp price changes.

Economic calendar for August 11

The unexpected growth of the UK's GDP by 0.2% in the second quarter compared to the previous three months came as a surprise to analysts who expected a zero change in the indicator. This coincided with the release of data on industrial production in the country, which reached its highest level in three years. In June 2023, industrial production grew by 1.8% compared to the previous month, recovering after a decrease of 0.6% in the previous month. This significant growth in industrial activity exceeded market expectations by 0.1% and was the best since August 2020.

These positive statistical data supported the British currency.

During the American trading session, the release of producer price data in the United States is expected, and most likely, the growth rate of these prices will accelerate from 0.1% to 0.7%. This could contribute to the continued rise in inflation. Such a turn of events might lead the Federal Reserve to eventually continue raising the interest rate. Such expectations could positively influence the value of the dollar.

EUR/USD trading plan for August 11

If the price continues to hold below the 1.0900 level, traders will consider the possibility of a bearish scenario, which might lead to a continuation of the corrective cycle.

On the other hand, if the price remains firmly above the 1.1050 level, then a bullish scenario becomes relevant. In this case, the market might begin a phased process of restoring the euro rate, which, over time, could indicate the end of the current corrective movement.

This image is no longer relevant

GBP/USD trading plan for August 11

A stable price hold below the 1.2700 level increases the likelihood of further decline, which, according to technical analysis, might lead to the continuation of the corrective cycle. However, for the realization of an alternative scenario related to the potential increase in the volume of long positions in the pound sterling, the quote first needs to return above the 1.2700 level during the daily period. A clear signal of a potential end to the corrective cycle will only be observed after a stable hold of the price above the 1.2800 value.

This image is no longer relevant

What's on the charts

The candlestick chart type is white and black graphic rectangles with lines above and below. With a detailed analysis of each individual candle, you can see its characteristics relative to a particular time frame: opening price, closing price, intraday high and low.

Horizontal levels are price coordinates, relative to which a price may stop or reverse its trajectory. In the market, these levels are called support and resistance.

Circles and rectangles are highlighted examples where the price reversed in history. This color highlighting indicates horizontal lines that may put pressure on the asset's price in the future.

The up/down arrows are landmarks of the possible price direction in the future.

Gven Podolsky,
Analytical expert of InstaForex
© 2007-2025
Summary
Urgency
Analytic
Vladislav Tukhmenev
Start trade
Earn on cryptocurrency rate changes with InstaForex
Download MetaTrader 4 and open your first trade
  • Grand Choice
    Contest by
    InstaForex
    InstaForex always strives to help you
    fulfill your biggest dreams.
    JOIN CONTEST

Recommended Stories

Trading Recommendations and Trade Breakdown for GBP/USD on July 29: The Pound Didn't Expect This from von der Leyen

The GBP/USD currency pair traded more calmly on Monday. The European trading session passed entirely in a flat range, but during the U.S. session, the euro pulled the pound downward

Paolo Greco 03:44 2025-07-29 UTC+2

Trading Recommendations and Trade Breakdown for EUR/USD on July 29: The Euro Takes a Hit to Its Ambitions

On Monday, the EUR/USD currency pair was engaged in just one activity — it was falling. Over the past six months, we haven't seen many crashes in the euro

Paolo Greco 03:44 2025-07-29 UTC+2

How to Trade the GBP/USD Pair on July 28? Simple Tips and Trade Analysis for Beginners

Analysis of Friday's Trades 1H Chart of GBP/USD On Friday, the GBP/USD pair continued its decline, which began on Thursday. First, we would like to point out that the fall

Paolo Greco 07:25 2025-07-28 UTC+2

How to Trade the EUR/USD Pair on July 28? Simple Tips and Trade Analysis for Beginners

Analysis of Friday's Trades 1H Chart of EUR/USD On Friday, the EUR/USD currency pair traded with minimal decline. By the end of the day, the euro had settled below

Paolo Greco 06:18 2025-07-28 UTC+2

Trading Recommendations and Trade Breakdown for GBP/USD on July 28: The Pound Plunged Sharply but Hasn't Lost Its Momentum

On Friday, the GBP/USD currency pair was trading in a downtrend. The price easily broke through the Senkou Span B and Kijun-sen lines, as well as worked through the 1.3420

Paolo Greco 03:48 2025-07-28 UTC+2

Trading Recommendations and Trade Breakdown for EUR/USD on July 28: The Ideal, Strong Euro

On Friday, the EUR/USD currency pair once again traded with low volatility but demonstrated nearly perfect technical behavior. There was little news during the day, with the only noteworthy report

Paolo Greco 03:48 2025-07-28 UTC+2

How to Trade the GBP/USD Pair on July 25? Simple Tips and Trade Analysis for Beginners

Analysis of Thursday's Trades 1H Chart of GBP/USD On Thursday, the GBP/USD pair exhibited a relatively strong decline, triggered by weak business activity indices in the UK. However, this explanation

Paolo Greco 06:43 2025-07-25 UTC+2

How to Trade the EUR/USD Pair on July 25? Simple Tips and Trade Analysis for Beginners

Analysis of Thursday's Trades 1H Chart of EUR/USD The EUR/USD currency pair showed no significant movements on Thursday and remained in low volatility, despite it being the most eventful

Paolo Greco 06:43 2025-07-25 UTC+2

Trading Recommendations and Trade Breakdown for GBP/USD on July 25: The Pound Finds Time for a Correction

On Thursday, the GBP/USD currency pair traded lower, which can be considered a local correction. This movement will cease to be a correction only if the price consolidates below

Paolo Greco 04:17 2025-07-25 UTC+2

Trading Recommendations and Trade Breakdown for EUR/USD on July 25: The Market Wanders Aimlessly

On Thursday, the EUR/USD currency pair exhibited astonishingly low volatility and a complete unwillingness to move in any clear direction. Many traders were expecting active movements during

Paolo Greco 04:17 2025-07-25 UTC+2
Can't speak right now?
Ask your question in the chat.
Widget callback
 

Dear visitor,

Your IP address shows that you are currently located in the USA. If you are a resident of the United States, you are prohibited from using the services of InstaFintech Group including online trading, online transfers, deposit/withdrawal of funds, etc.

If you think you are seeing this message by mistake and your location is not the US, kindly proceed to the website. Otherwise, you must leave the website in order to comply with government restrictions.

Why does your IP address show your location as the USA?

  • - you are using a VPN provided by a hosting company based in the United States;
  • - your IP does not have proper WHOIS records;
  • - an error occurred in the WHOIS geolocation database.

Please confirm whether you are a US resident or not by clicking the relevant button below. If you choose the wrong option, being a US resident, you will not be able to open an account with InstaForex anyway.

We are sorry for any inconvenience caused by this message.