

Actual patterns
Patterns are graphical models which are formed in the chart by the price. According to one of the technical analysis postulates, history (price movement) repeats itself. It means that the price movements are often similar in the same situations which makes it possible to predict the further development of the situation with a high probability.
Actual Patterns
- All
- Double Top
- Flag
- Head and Shoulders
- Pennant
- Rectangle
- Triangle
- Triple top
- All
- #AAPL
- #AMZN
- #Bitcoin
- #EBAY
- #FB
- #GOOG
- #INTC
- #KO
- #MA
- #MCD
- #MSFT
- #NTDOY
- #PEP
- #TSLA
- #TWTR
- AUDCAD
- AUDCHF
- AUDJPY
- AUDUSD
- EURCAD
- EURCHF
- EURGBP
- EURJPY
- EURNZD
- EURRUB
- EURUSD
- GBPAUD
- GBPCHF
- GBPJPY
- GBPUSD
- GOLD
- NZDCAD
- NZDCHF
- NZDJPY
- NZDUSD
- SILVER
- USDCAD
- USDCHF
- USDJPY
- USDRUB
- All
- M5
- M15
- M30
- H1
- D1
- All
- Buy
- Sale
- All
- 1
- 2
- 3
- 4
- 5
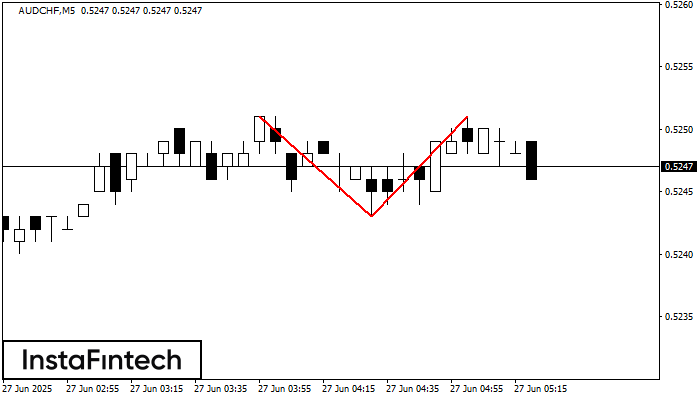
On the chart of AUDCHF M5 the Double Top reversal pattern has been formed. Characteristics: the upper boundary 0.5251; the lower boundary 0.5243; the width of the pattern 8 points
The M5 and M15 time frames may have more false entry points.
Open chart in a new window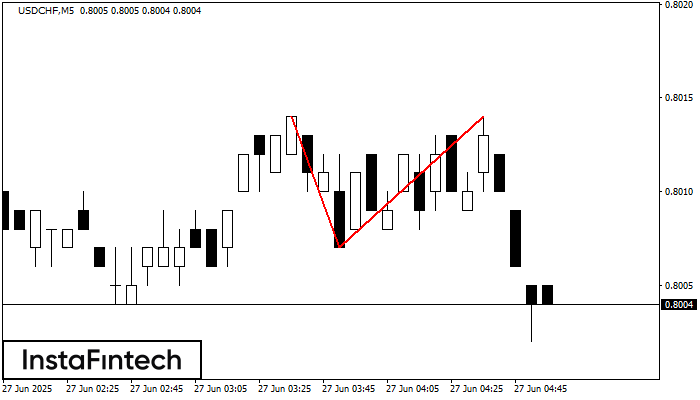
On the chart of USDCHF M5 the Double Top reversal pattern has been formed. Characteristics: the upper boundary 0.8014; the lower boundary 0.8007; the width of the pattern 7 points
The M5 and M15 time frames may have more false entry points.
Open chart in a new window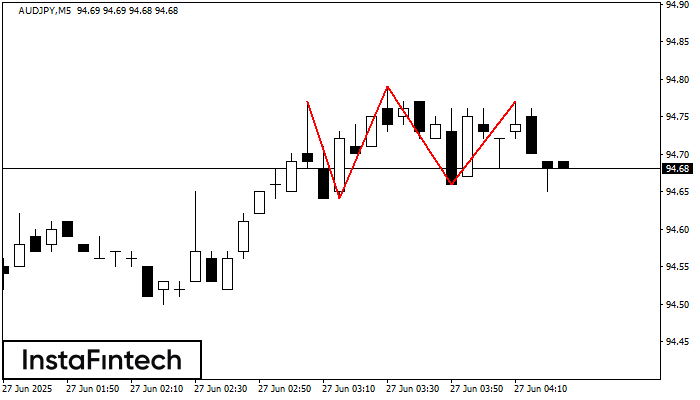
On the chart of the AUDJPY M5 trading instrument, the Triple Top pattern that signals a trend change has formed. It is possible that after formation of the third peak
The M5 and M15 time frames may have more false entry points.
Open chart in a new window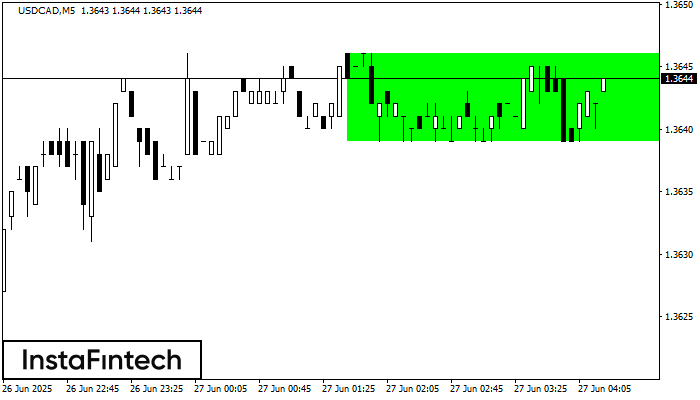
According to the chart of M5, USDCAD formed the Bullish Rectangle. This type of a pattern indicates a trend continuation. It consists of two levels: resistance 1.3646 and support 1.3639
The M5 and M15 time frames may have more false entry points.
Open chart in a new window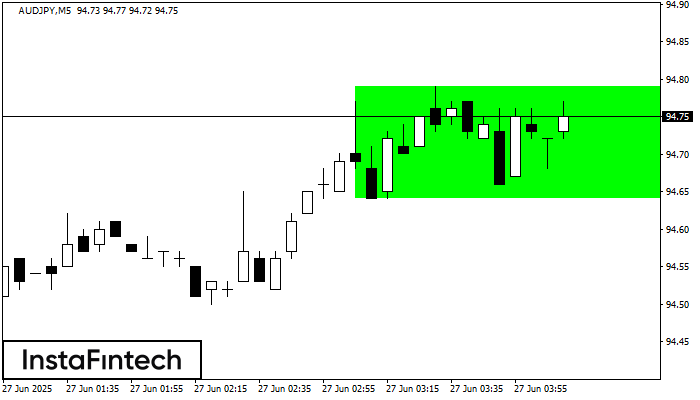
According to the chart of M5, AUDJPY formed the Bullish Rectangle. The pattern indicates a trend continuation. The upper border is 94.79, the lower border is 94.64. The signal means
The M5 and M15 time frames may have more false entry points.
Open chart in a new window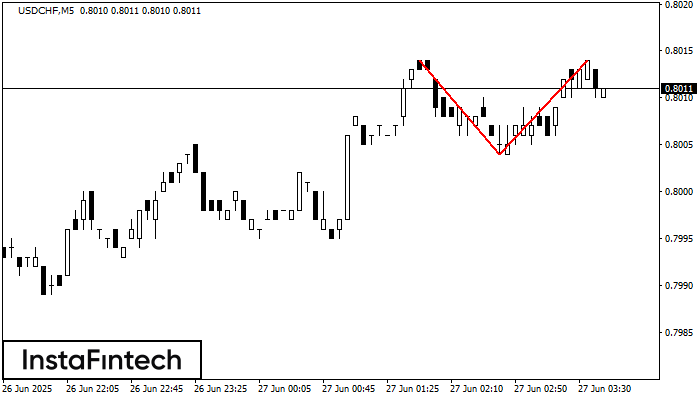
On the chart of USDCHF M5 the Double Top reversal pattern has been formed. Characteristics: the upper boundary 0.8014; the lower boundary 0.8004; the width of the pattern 10 points
The M5 and M15 time frames may have more false entry points.
Open chart in a new window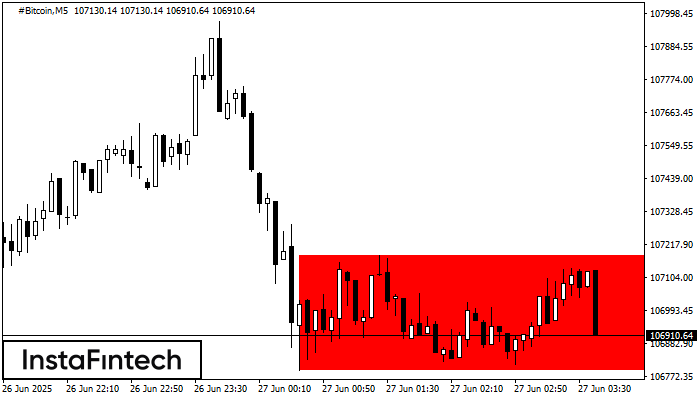
According to the chart of M5, #Bitcoin formed the Bearish Rectangle. This type of a pattern indicates a trend continuation. It consists of two levels: resistance 107179.04 - 0.00
The M5 and M15 time frames may have more false entry points.
Open chart in a new window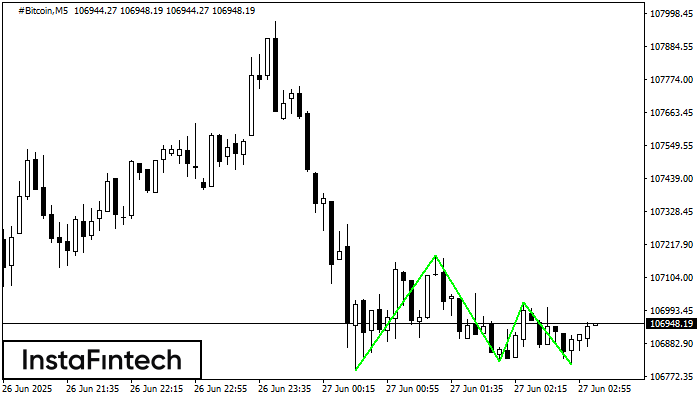
The Triple Bottom pattern has been formed on #Bitcoin M5. It has the following characteristics: resistance level 107179.04/107022.10; support level 106791.83/106811.21; the width is 38721 points. In the event
The M5 and M15 time frames may have more false entry points.
Open chart in a new window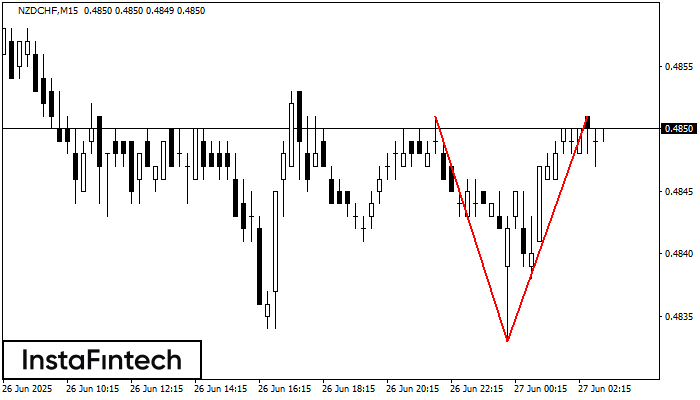
On the chart of NZDCHF M15 the Double Top reversal pattern has been formed. Characteristics: the upper boundary 0.4851; the lower boundary 0.4833; the width of the pattern 18 points
The M5 and M15 time frames may have more false entry points.
Open chart in a new window


