Analysis of Thursday's Trades:
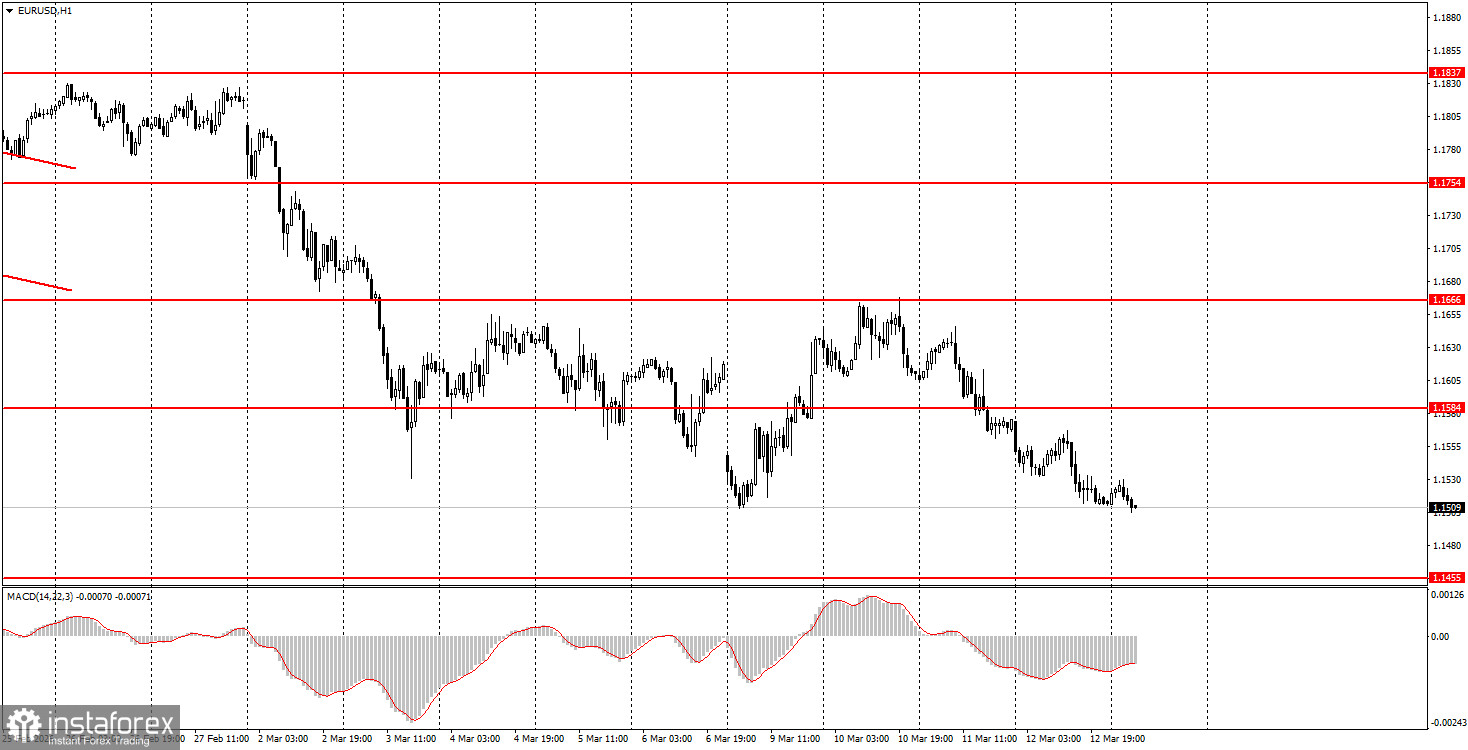
1H Chart of the EUR/USD Pair
The EUR/USD currency pair continued its slow decline on Thursday, driven solely by geopolitical factors. The decline did not cease even overnight, indicating the market's confidence in its actions. While a week ago we witnessed a panic sell-off and a flight from risk, now we see well-considered, justified purchases of the dollar that are not driven by emotion. As before, the macroeconomic backdrop has no impact on trader sentiment or the pair's movements. The situation in the Middle East remains complicated, with the likelihood of unlocking the Strait of Hormuz in the near future approaching zero. Iran has begun striking not only the oil and gas infrastructure in the region and American military bases but also tankers that are associated with the EU or the U.S. Thus, oil prices continue to rise, and the most concerning aspect is that they are likely to keep rising. Many countries are now tapping into their strategic oil reserves, but these will not last long. Once the world is hit by a wave of scarcity, prices could increase by another 50-100%.
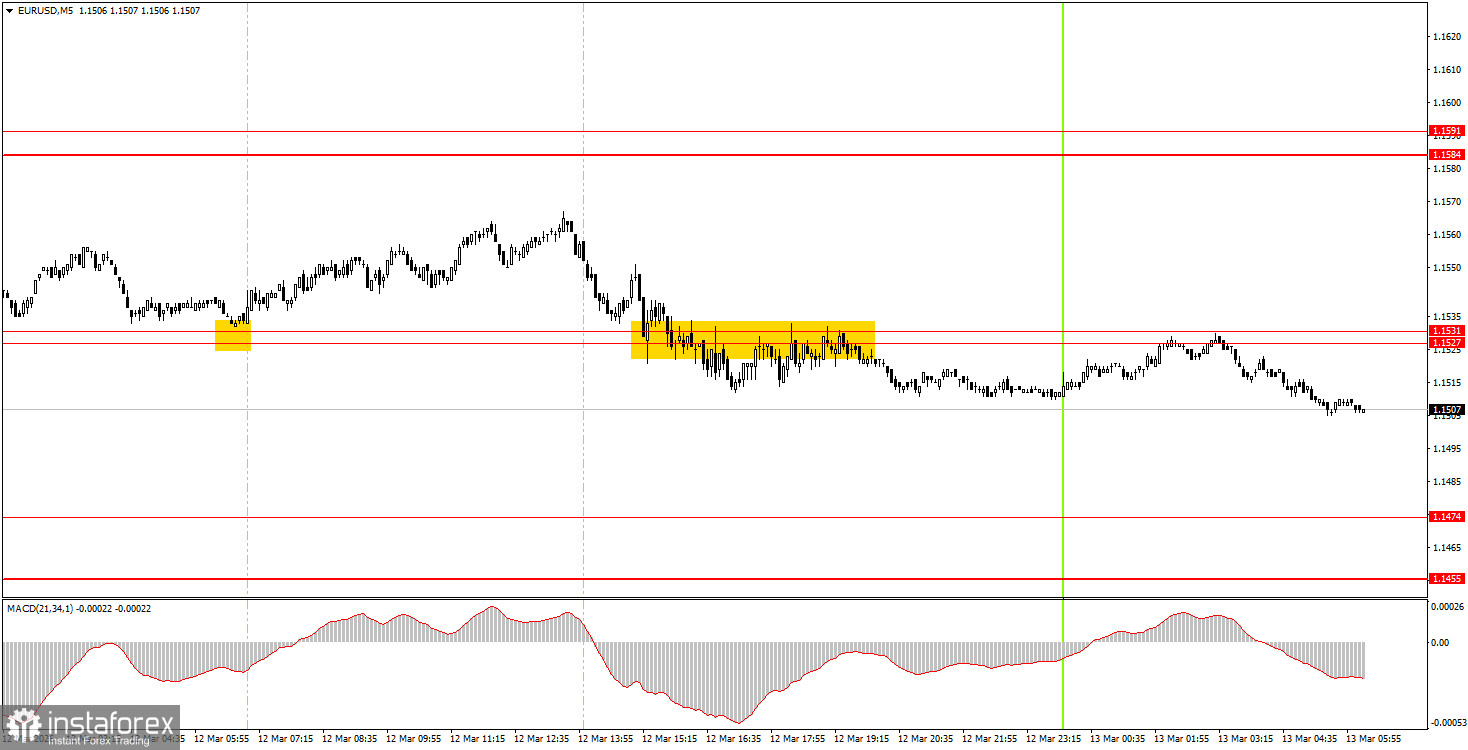
5M Chart of the EUR/USD Pair
On the 5-minute timeframe, two trading signals were generated on Thursday. At the very beginning of the European session, the pair bounced off the 1.1527-1.1531 area, triggering a rise of 25 pips. Thus, traders did not incur losses on long positions. Later, during the American trading session, a sell signal formed in the same area, but it proved weaker. By the end of the day, beginners could either manually close their trades or carry them over to the next day.
How to Trade on Friday:
On the hourly timeframe, the downward trend persists amid renewed war in the Middle East. A long-term upward trend has resumed at the beginning of 2026, so we expect new medium-term growth for the euro. The overall fundamental backdrop remains very challenging for the U.S. currency, as confirmed by reports on the labor market, GDP, and unemployment. However, the market's key focus at this time is geopolitics, not economics.
On Friday, beginner traders may consider remaining in short positions if the price consolidates below the 1.1527-1.1531 area, with a target at 1.1455-1.1474. A price consolidation above the 1.1527-1.1531 area would allow for long positions, targeting 1.1584-1.1591.
On the 5-minute timeframe, the following levels should be considered: 1.1354-1.1363, 1.1413, 1.1455-1.1474, 1.1527-1.1531, 1.1584-1.1591, 1.1655-1.1666, 1.1745-1.1754, 1.1830-1.1837, 1.1899-1.1908. On Friday, the EU will release a report on industrial production, while in the U.S., the Personal Consumption Expenditures (PCE) index, the GDP for the fourth quarter (second estimate), durable goods orders, the JOLTs report on open vacancies, and the University of Michigan consumer sentiment index will be published.
Key Principles of the Trading System:
- The strength of a signal is determined by the time it takes to form the signal (bounce or breakout). The less time taken, the stronger the signal.
- If two or more trades have been opened at a particular level based on false signals, all subsequent signals from that level should be ignored.
- In a flat market, any pair can form many false signals or none at all. In any case, at the first signs of a flat trend, it is best to stop trading.
- Trading deals are to be opened during the period between the start of the European session and the mid-American session, after which all trades should be closed manually.
- On the hourly timeframe, it is preferable to trade based on signals from the MACD indicator only when there is good volatility and a trend confirmed by a trend line or trend channel.
- If two levels are positioned too close together (5-20 pips apart), they should be considered a support or resistance area.
- Upon moving 15 pips in the correct direction, a Stop Loss should be set to breakeven.
What to Look for on the Charts:
Price levels of support and resistance are levels that serve as targets when opening buys or sells. Take Profit levels can be placed around them.
Red lines represent channels or trend lines that show the current trend and indicate the direction in which it is preferable to trade now.
The MACD indicator (14,22,3) – the histogram and the signal line – is a supporting indicator that can also be used as a source of signals.
Important speeches and reports (always included in the news calendar) can significantly affect the movement of the currency pair. Therefore, during their release, trading should be done with utmost caution, or traders should exit the market to avoid sharp price reversals against the previous movement.
Beginning traders in the forex market should remember that not every trade can be profitable. Developing a clear strategy and effective money management are the keys to long-term trading success.