Bitcoin has recovered about $10,000 over the last 10 days. However, this movement cannot be considered a full-fledged correction. "Digital gold" is currently much closer to resuming its decline than starting a significant correction. The only pattern that could theoretically support any corrective movement is the "bullish" IFVG on the 4-hour timeframe, but it did not support it. On Saturday, a new bullish FVG formed, which could support Bitcoin's growth, but it is already evident that there has been no reaction to this pattern. We lean towards either a flat movement or a resumption of a major decline in the first cryptocurrency.
The crypto community remains divided among traders, investors, companies, and interested parties. Traders see a downward trend; investors flee to safer assets amid overall political instability in the U.S. and geopolitical uncertainty; companies are losing money and investors are withdrawing; while interested parties observe an outflow of investment from the crypto segment and falling prices. Therefore, it is not surprising that the last two categories of "experts" continue to insist that Bitcoin will "set a new ATH this year." They need new demand and new investments for Bitcoin to start moving north again, not south.
Meanwhile, MicroStrategy continues to incur losses. Former CEO Michael Saylor continues to convince the market that a new "surge" of digital gold is imminent and that, in the long term, BTC will be priced at over $1 million. However, we currently see the opposite picture. Not only is Bitcoin falling (and, consequently, the capital of MicroStrategy), but the company's stock is also falling in proportion to Bitcoin's decline. This results in a double blow, as the current liquidity and capital issues stem from the company's decision to turn itself into a "Bitcoin safe." Experts believe that if MicroStrategy sells its Bitcoin, the entire market could enter another steep decline. The sale of Bitcoin by Michael Saylor's company would indirectly indicate that the "buy Bitcoin with all your money" strategy has failed.
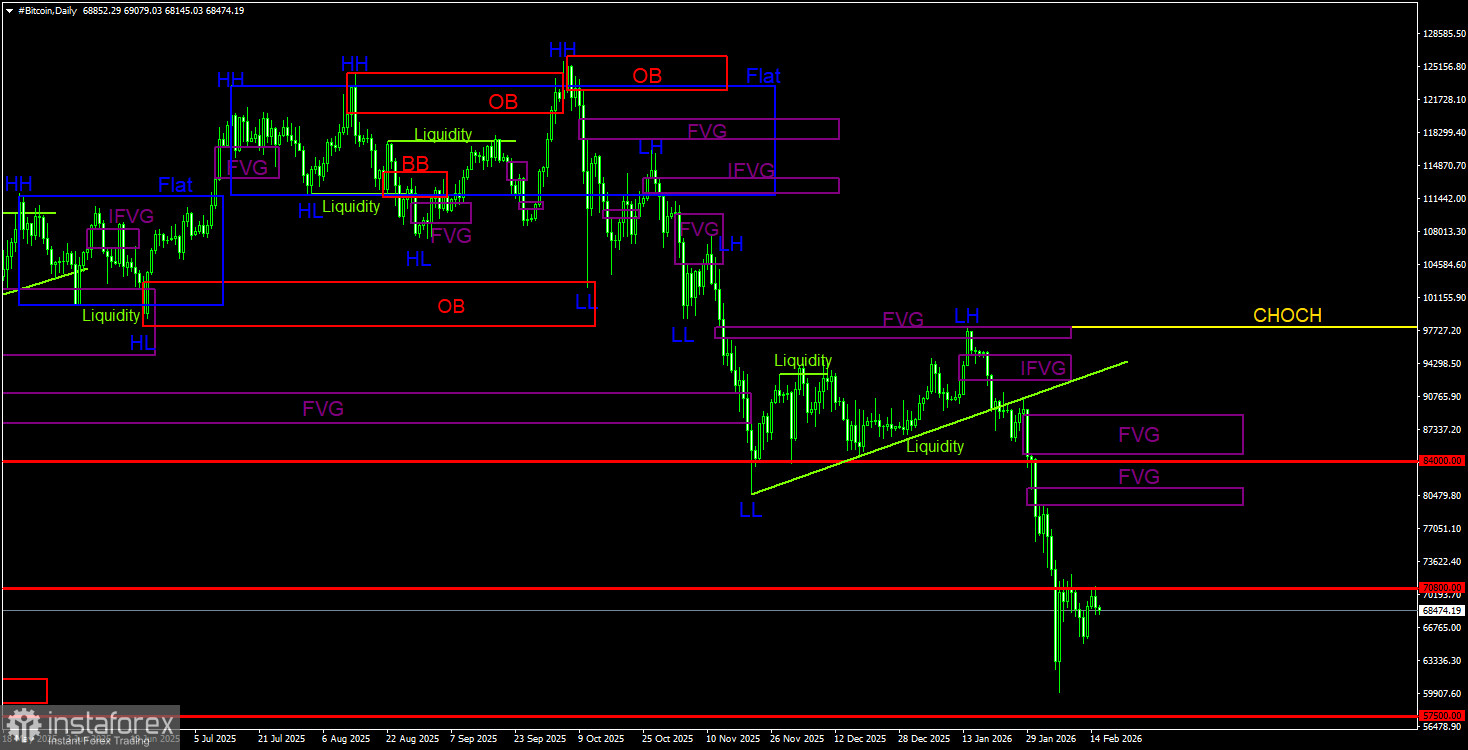
General Picture of BTC/USD on the 1D Timeframe
On the daily timeframe, Bitcoin continues to form a downward trend. The trend is downward, and the CHOCH line is currently at $97,900. Only above this level can it be considered that the downward trend is completed. It is worth noting that a sell signal was formed within the "bearish" FVG ($96,900 – $98,000) and received confirmation on the lower timeframe. Thus, traders had an excellent opportunity to capture almost the entire recent downward movement. The current target remains the level of $57,500 – 61.8% Fibonacci. Given the lack of signs of a reversal, we believe the decline will continue. On the daily timeframe, the nearest POI area for new sell deals is in the range of $79,500 – $81,100, but Bitcoin still needs to reach it.
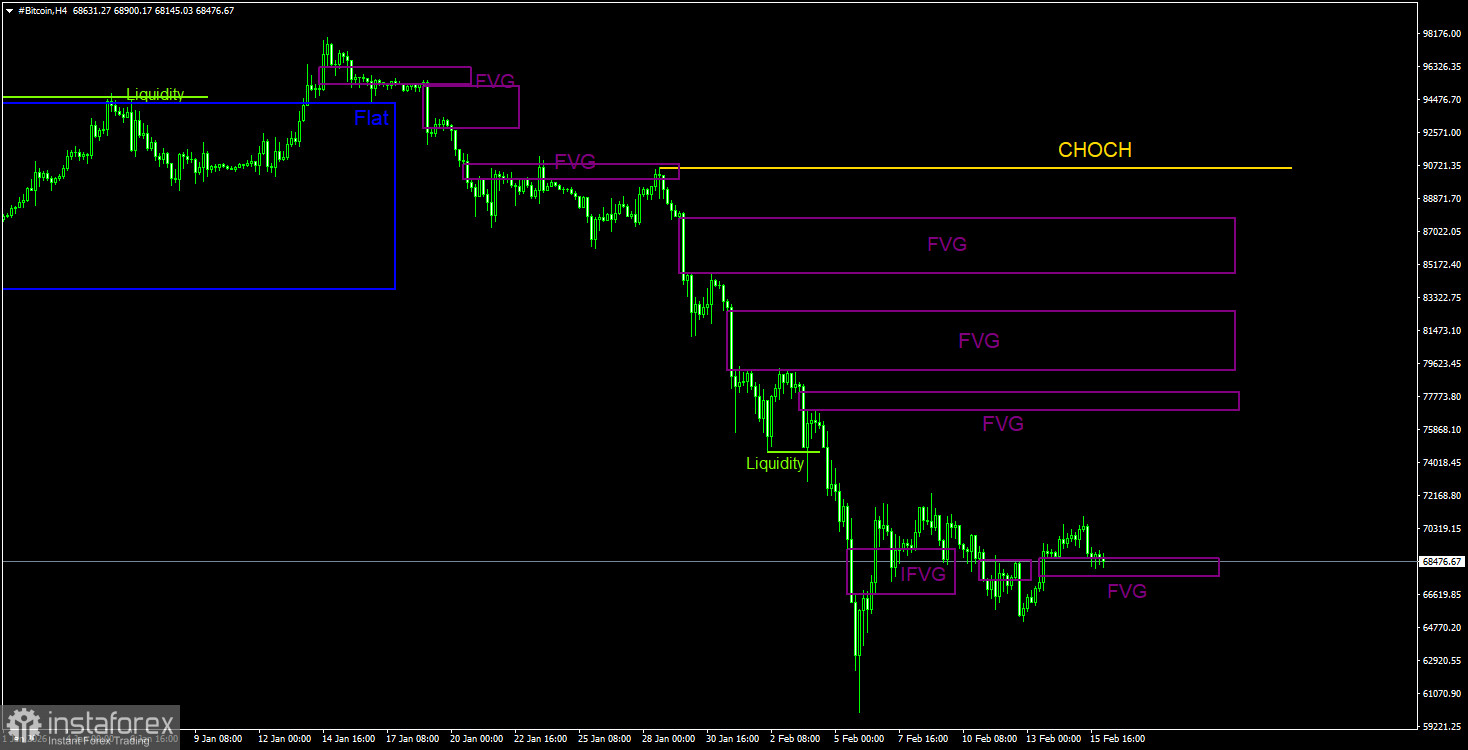
General Picture of BTC/USD on the 4H Timeframe
On the 4-hour timeframe, the price continues to form a downward structure. The CHOCH line is at $90,560; only above that level can we talk about a trend shift to an upward one. However, at this moment, there are no signs that Bitcoin will complete the decline anytime soon. The bullish IFVG pattern failed to elicit a tangible reaction. The only bearish reaction pattern also yielded no results. A new bullish FVG was formed last week, which could theoretically spark a small upward move in "digital gold." However, the current technical picture resembles a flat more than anything else.
Recommendations for Trading BTC/USD:
Bitcoin continues to form a full-fledged downward trend. We expect a decline with a target of $57,500 (the 61.8% Fibonacci level from a three-year upward trend), and there are currently no signs of a trend reversal. However, even the level of $57,500 does not seem like a final stop anymore. Among the POI areas for sell trades on the daily timeframe, the last bearish FVG can be noted, but Bitcoin is still far from it. On the 4-hour timeframe, there are three unaddressed bearish FVGs. However, these patterns belong to the previous trend and are unlikely to trigger its renewal.
Explanations for Illustrations:
CHOCH – change of character in the trend structure.
Liquidity – Stop Loss of traders, which market makers use to build their positions.
FVG – Fair Value Gap. The price passes through such areas very quickly, indicating a complete absence of one side in the market. Subsequently, the price tends to return and react to such areas.
IFVG – Inverted Fair Value Gap. After returning to such an area, the price does not react, breaks through it impulsively, and then tests it from the other side.
OB – Order Block. The candle from which the market maker opened a position to collect liquidity for forming their own position in the opposite direction.