Top.Mail.Ru
empty
02.01.2025 05:21 PM
Analysis of EUR/USD on January 2, 2024

This image is no longer relevant

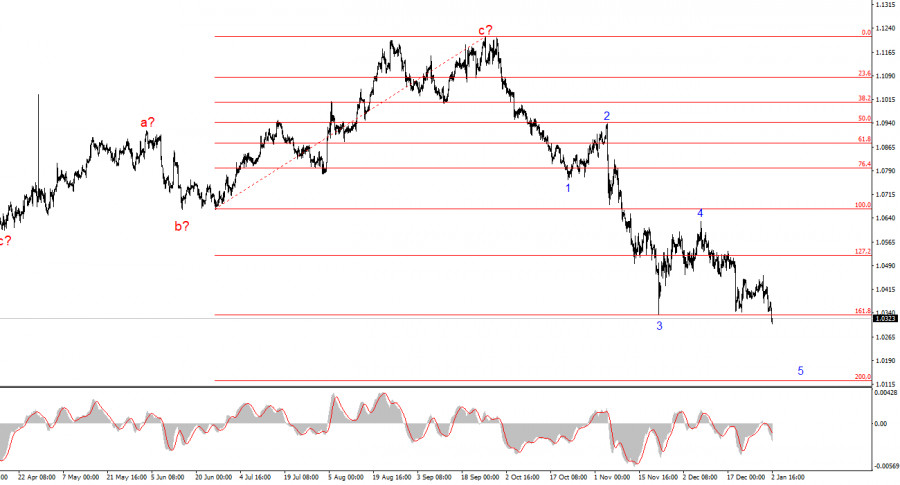
The wave pattern on the 4-hour chart for the EUR/USD pair is becoming increasingly clear and coherent. Since January 2024, I can identify only two three-wave structures (a-b-c) with a pivot point on April 16. After the completion of wave c in the upward structure, a new downward structure began to form, which has a high chance of being impulsive. If this is indeed the case, we can expect a more convincing fifth wave, after which the pair may transition into a prolonged and complex corrective structure.

Overall, the current wave pattern appears straightforward and logical. It's worth noting that while the news background can mislead for a month, two, or even three, it cannot do so indefinitely. Recent U.S. reports show that the economy is not facing significant issues—there is no recession, nor is one anticipated. The economy may slow down, but its current growth rates suggest it can weather this phase without major losses. The Federal Reserve is likely to ease monetary policy more slowly and modestly than the market expected at the beginning of the year. The ECB, on the other hand, sees no reason to pause and will continue its easing.

The Euro Resumes the Fifth Wave

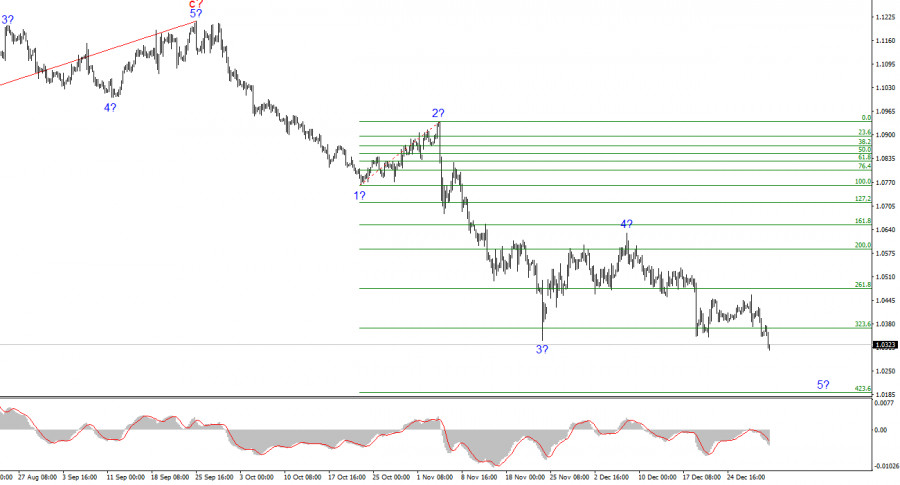
The EUR/USD rate declined by 40 basis points on Thursday. While I didn't expect significant market activity on the year's first trading day, the movements were not entirely negligible either. Although 40 points is a small decline, the instrument has been gradually falling over recent weeks. This aligns with my earlier belief that the proposed fifth wave in the primary trend has already begun. Today, after successfully breaking the low of wave 3, my confidence in this pattern has only grown. Thus, I expect the market to continue reducing demand for the euro, and the instrument may soon approach the 1.0190 level, which corresponds to the 423.6% Fibonacci level.

The news background began to re-emerge on Thursday after a two-week lull. Manufacturing activity indices were released in Germany and the Eurozone (as well as several other EU countries). However, the final values of these indices offered no surprises and, therefore, could not have triggered the euro's decline. In my view, the decline at the start of the year is merely due to the incomplete formation of wave 5. To complete this wave, the market does not necessarily need supportive news for the U.S. dollar. I believe the instrument will find it challenging to fall below the 1.0200 level, but a successful attempt to break this level could indicate an extension of wave 5 within wave 1.

This image is no longer relevant

General Conclusions

Based on the conducted analysis of EUR/USD, I conclude that the instrument continues to form a new downward trend segment. A failed attempt to break through the 1.1184 level indicated the start of a series of downward waves. Three failed attempts to breach the 200.0% Fibonacci mark suggested readiness to form wave 5, with targets extending to the 1.0200 level. Hence, selling remains relevant for me.

On a larger wave scale, the wave structure is transforming into a more complex pattern, predominantly consisting of corrective structures. We are likely to see a new set of downward waves, though its length and structure are currently difficult to predict.

Key Principles of My Analysis:

  1. Wave structures should be simple and clear. Complex structures are challenging to trade and often subject to changes.
  2. If uncertain about the market's direction, it is better to stay out.
  3. Absolute certainty in price direction never exists. Always use protective Stop Loss orders.
  4. Wave analysis can be combined with other types of analysis and trading strategies.
Chin Zhao,
انسٹافاریکس کا تجزیاتی ماہر
© 2007-2025
Summary
Urgency
Analytic
Alexander Dneprovskiy
Start trade
انسٹافاریکس کے ساتھ کرپٹو کرنسی کی معاملاتی تبدیلیوں سے کمائیں۔
میٹا ٹریڈر 4 ڈاؤن لوڈ کریں اور اپنی پہلی ٹریڈ کھولیں۔
  • Grand Choice
    Contest by
    InstaForex
    InstaForex always strives to help you
    fulfill your biggest dreams.
    مقابلہ میں شامل ہوں

تجویز کردہ مضامین

یورو / یو ایس ڈی تجزیہ برائے 31 جولائی 2025

یورو / یو ایس ڈی کے لیے 4 گھنٹے کے چارٹ پر لہر کا نمونہ کئی مہینوں سے بدستور برقرار ہے۔ رجحان کا اوپر کی طرف حصہ بننا جاری ہے،

Chin Zhao 21:10 2025-07-31 UTC+2

جی بی پی / یو ایس ڈی کا تجزیہ برائے 31 جولائی 2025

جی بی پی / یو ایس ڈی کے لیے لہر کا نمونہ تیزی کے تسلسل کی لہر کے ڈھانچے کی ترقی کی نشاندہی کرتا ہے۔ لہر کی ترتیب یورو

Chin Zhao 21:05 2025-07-31 UTC+2

جولائی 29 کو یورو / یو ایس ڈی: بلز مارکیٹ کو 1.189 کی سطح کی طرف دھکیل سکتے ہیں

طویل مدت میں، یورو / یو ایس ڈی مارکیٹ ایک بڑی تیزی کی اصلاح (بی) تشکیل دے رہی ہے، جو معیاری اے بی سی زگ زیگ کی شکل اختیار

Roman Onegin 19:06 2025-07-29 UTC+2

یورو / یو ایس ڈی کا تجزیہ برائے 17 جولائی 2025

یورو / یو ایس ڈی کے لیے 4 گھنٹے کے چارٹ پر لہر کا پیٹرن مسلسل کئی مہینوں سے غیر تبدیل شدہ ہے۔ اوپر کی طرف رجحان والے

Chin Zhao 21:57 2025-07-16 UTC+2

جولائی 16 2025 کو جی بی پی / یو ایس ڈی تجزیہ

جی بی پی / یو ایس ڈی کے لیے لہر کا پیٹرن بلش امپلس ویو پیٹرن کی تشکیل کی نشاندہی کرتا ہے۔ لہر کی ترتیب تقریباً یورو

Chin Zhao 21:53 2025-07-16 UTC+2

یورو / یو ایس ڈی کا تجزیہ برائے 30 جون 2025

یورو / یو ایس ڈی کے لیے 4 گھنٹے کے چارٹ پر لہر کا پیٹرن اوپر کی طرف رجحان والے حصے کی تشکیل کی نشاندہی کرتا ہے۔ 28 فروری تک،

Chin Zhao 20:17 2025-06-30 UTC+2

جی بی پی / یو ایس ڈی : تجزیہ اور پیشن گوئی

جی بی پی / یو ایس ڈی کے لیے لہر کا پیٹرن اوپر کی طرف آنے والی لہر کے پیٹرن کی تشکیل کی تجویز کرتا ہے۔ لہر کی تصویر تقریباً

Chin Zhao 20:14 2025-06-30 UTC+2

یورو / یو ایس ڈی کا تجزیہ برائے 23 جون 2025

یہ کہ 4 گھنٹے کے یورو / یو ایس ڈی چارٹ کا لہر پیٹرن اوپر کی طرف رجحان والے حصے کی ترقی کی نشاندہی کرتا ہے۔ یہ تبدیلی

Chin Zhao 19:35 2025-06-23 UTC+2

یورو / یو ایس ڈی کا تجزیہ برائے 18 جون 2025

یورو / یو ایس ڈی پئیر کے 4 گھنٹے کے چارٹ پر لہر کا پیٹرن تیزی کے رجحان والے حصے کی تشکیل کی نشاندہی کرتا ہے۔ یہ تبدیلی مکمل

Chin Zhao 20:02 2025-06-18 UTC+2

جون 16 2025 کو یورو / یو ایس ڈی تجزیہ

چار گھنٹے کے یورو / یو ایس ڈی چارٹ پر لہر کا پیٹرن اوپر کی طرف رجحان والے حصے کی ترقی کی نشاندہی کرتا ہے۔ یہ تبدیلی

Chin Zhao 20:07 2025-06-16 UTC+2
ابھی فوری بات نہیں کرسکتے ؟
اپنا سوال پوچھیں بذریعہ چیٹ.
Widget callback
 

Dear visitor,

Your IP address shows that you are currently located in the USA. If you are a resident of the United States, you are prohibited from using the services of InstaFintech Group including online trading, online transfers, deposit/withdrawal of funds, etc.

If you think you are seeing this message by mistake and your location is not the US, kindly proceed to the website. Otherwise, you must leave the website in order to comply with government restrictions.

Why does your IP address show your location as the USA?

  • - you are using a VPN provided by a hosting company based in the United States;
  • - your IP does not have proper WHOIS records;
  • - an error occurred in the WHOIS geolocation database.

Please confirm whether you are a US resident or not by clicking the relevant button below. If you choose the wrong option, being a US resident, you will not be able to open an account with InstaForex anyway.

We are sorry for any inconvenience caused by this message.