Analysis of Thursday's Trades:
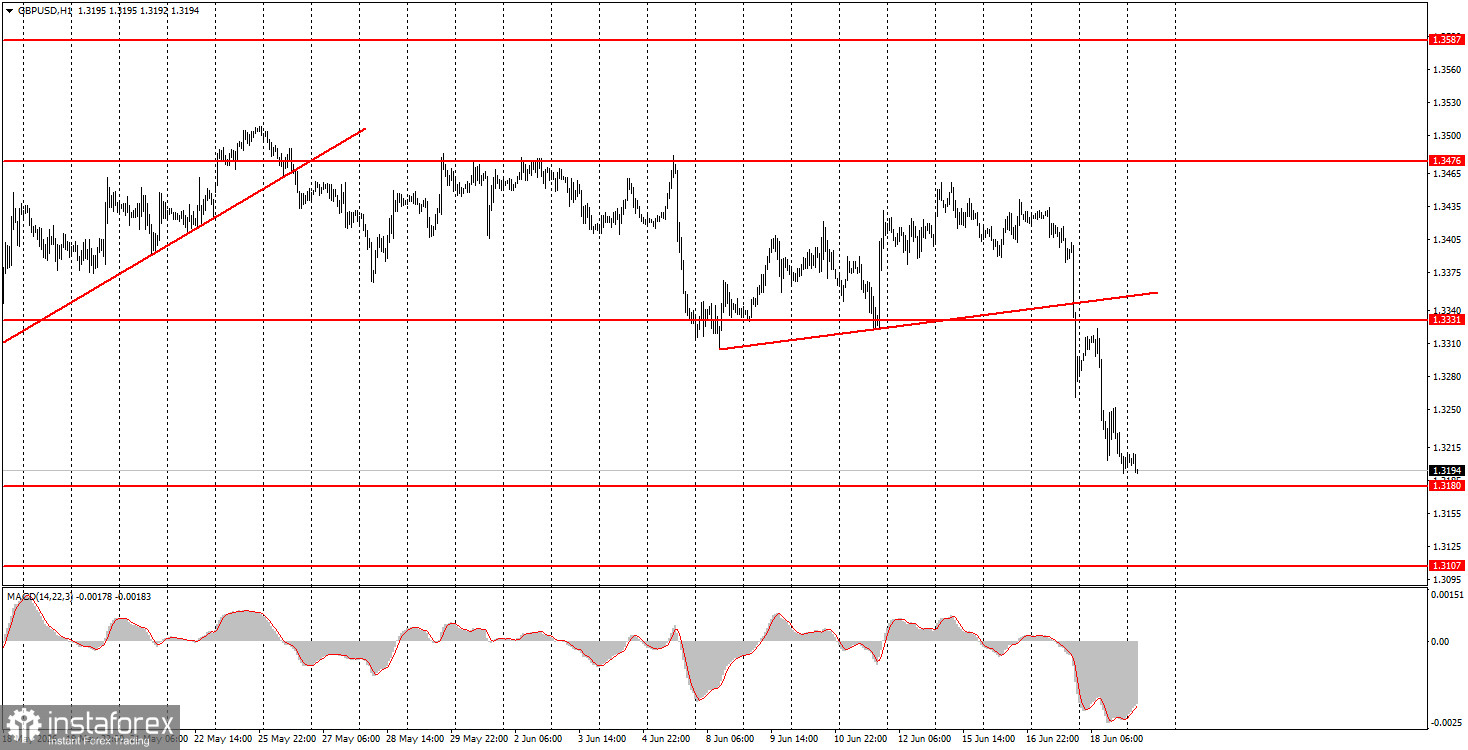
1H Chart of the GBP/USD Pair
The GBP/USD pair continued its sharp decline on Thursday after a minimal upward retracement. The market continued to react to the FOMC meeting's "hawkish" results, which can be considered hawkish in a rather formal sense. It is worth noting that the sentiment among Monetary Policy Committee members has indeed become more stringent. Now, at least half of the Federal Reserve officials expect a rate hike by the end of the year, while about a third anticipate two or more phases of policy tightening. However, we want to remind you that before the FOMC meeting, the market had expected precisely this—at least one rate hike by the end of the year.
Additionally, it is important to note that the results of the Bank of England meeting were announced yesterday and cannot be labeled "dovish," which led the British pound to lose another 100 pips in a single day. The BoE took a neutral position, which is entirely logical given recent reports on UK inflation indicating a slowdown in consumer prices. Nevertheless, the BoE meeting can be viewed as "conditionally hawkish," as two officials voted for a rate hike, although the market expected only one hawkish voice. Therefore, the British pound certainly did not deserve a further collapse.
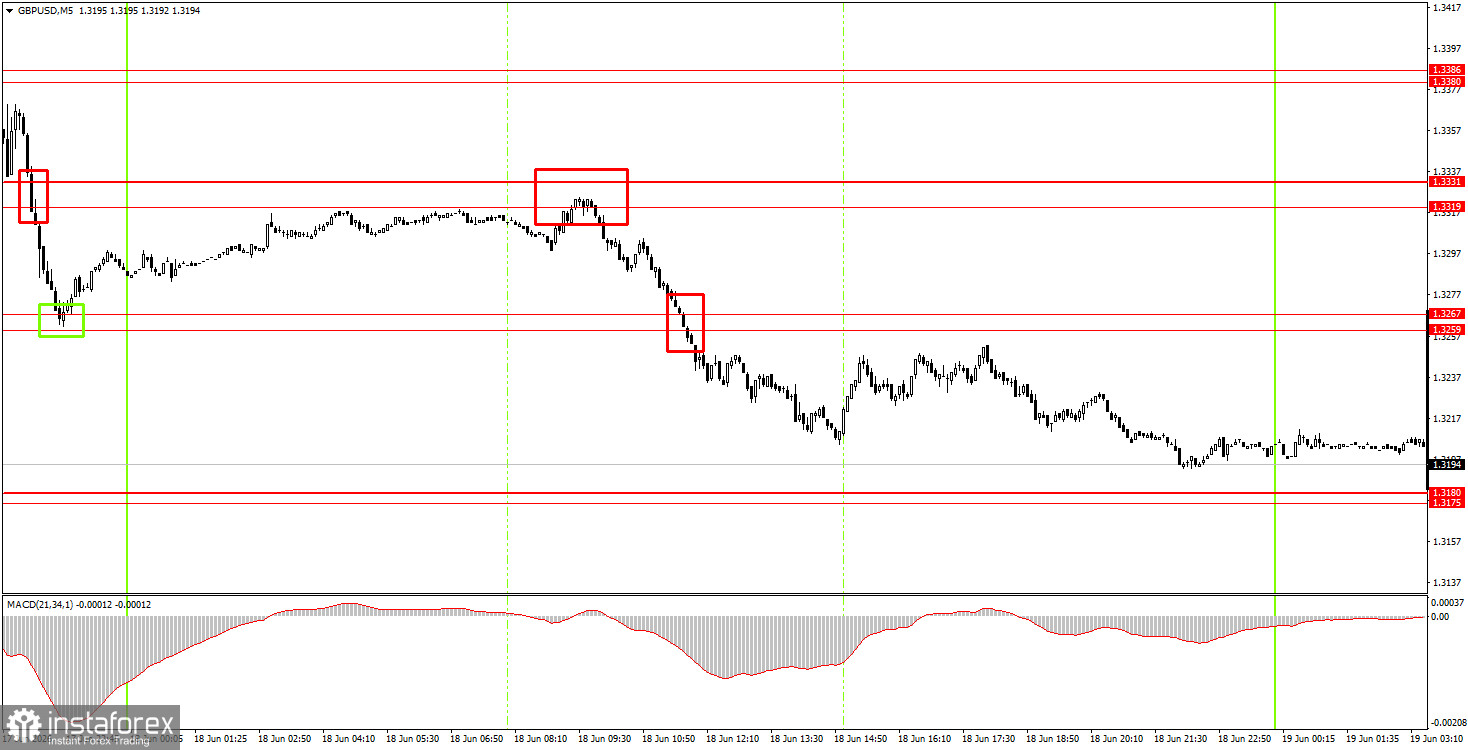
5M Chart of the GBP/USD Pair
In the 5-minute timeframe, two sell trading signals were generated on Thursday. At the beginning of the European trading session, the price bounced off the 1.3319-1.3331 area, allowing beginner traders to open a straightforward sell trade. A couple of hours later, the price broke through the 1.3259-1.3267 area. By the end of the day, the trade could have been closed with a profit of around 80 pips.
How to Trade on Friday:
On the hourly timeframe, the GBP/USD pair has left the sideways channel, but we doubt that the decline will continue. Of course, if serious reasons for a new strengthening of the dollar emerge, this scenario is possible. However, there are currently no such reasons. The conflict in the Middle East is resolved, and the Fed has only declared a potential rate hike by the end of the year. At this time, the rise of the dollar seems illogical.
On Friday, novice traders can open short positions targeting 1.3096-1.3107 if the price consolidates below the 1.3175-1.3180 area. A bounce from the 1.3175-1.3180 area will allow for long positions with a target of 1.3259-1.3267.
On the 5-minute timeframe, levels to consider include 1.3175-1.3180, 1.3259-1.3267, 1.3319-1.3331, 1.3380-1.3386, 1.3456-1.3476, 1.3587-1.3598, 1.3631-1.3641, 1.3695, and 1.3741-1.3751. On Friday, a retail sales report is scheduled for release in the UK, which is unlikely to be noted by traders. In the U.S., the economic calendar is empty.
Basic Rules of the Trading System:
- The strength of a signal is determined by the time required to form it (a bounce or a breakout). The less time taken, the stronger the signal.
- If two or more trades were opened at a particular level based on false signals, subsequent signals from that level should be ignored.
- In a flat market, any pair may form many false signals or none at all. Technical levels may be disregarded.
- On the hourly timeframe, trading signals from the MACD indicator should be executed only when volatility is good, and a trend is confirmed by a trend line or channel.
- If two levels are too close together (5 to 20 pips), they should be considered a support or resistance area.
- After moving 15 pips in the correct direction, a Stop Loss should be set at breakeven.
What's on the Charts:
Price levels (areas) of support and resistance are targets when opening long or short positions or sources of signals.
Red lines indicate channels or trend lines that display the current trend and indicate the preferred direction for trading.
The MACD indicator (14,22,3) – histogram and signal line – is a supplementary indicator that can also be used as a source of signals.
Important speeches and reports (contained in the news calendar) can significantly impact the movement of the currency pair. Therefore, during their release, trading should be conducted with maximum caution, or one should exit the market to avoid sharp reversals against preceding movements.
Beginners trading in the forex market should remember that not every trade can be profitable. Developing a clear strategy and practicing money management are key to long-term success in trading.