Bitcoin continues to trade with low volatility and has shown a notable decline in recent days. The price has broken the upward structure on the hourly timeframe, previously addressing the nearest "bearish" FVG on the daily chart, and then reached a "bullish" FVG without receiving any reaction. Thus, signs of a downward trend reversal are becoming increasingly apparent. The price target remains a liquidity pool on the daily timeframe.
Expert traders have repeatedly pointed out over the past month that the current rise is likely a market-maker manipulation, a "bull trap," or a simple correction. Spot interest in Bitcoin remains low, as spot transactions provide a stable trend. The market has risen primarily due to futures positions, which are generally short-term and speculative. Therefore, a long-term trend cannot be built on them.
Meanwhile, American television personality Kevin O'Leary stated that dollar-backed stablecoins are much more valuable than Bitcoin and other cryptocurrencies. O'Leary noted that Bitcoin remains a speculative asset subject to high volatility and sharp price swings, is not backed by any assets, and lacks intrinsic value. In contrast, stablecoins are backed by national currencies or Treasury bonds. O'Leary emphasized that stablecoins allow for money transfers in seconds without worrying about price fluctuations, unlike cryptocurrencies. They serve effectively not just as a means of payment but also as a storage medium. Nevertheless, the chairman of O'Leary Ventures believes that Bitcoin and Ethereum should be present in every investor's portfolio, but as investment assets rather than for daily transactions or capital preservation.
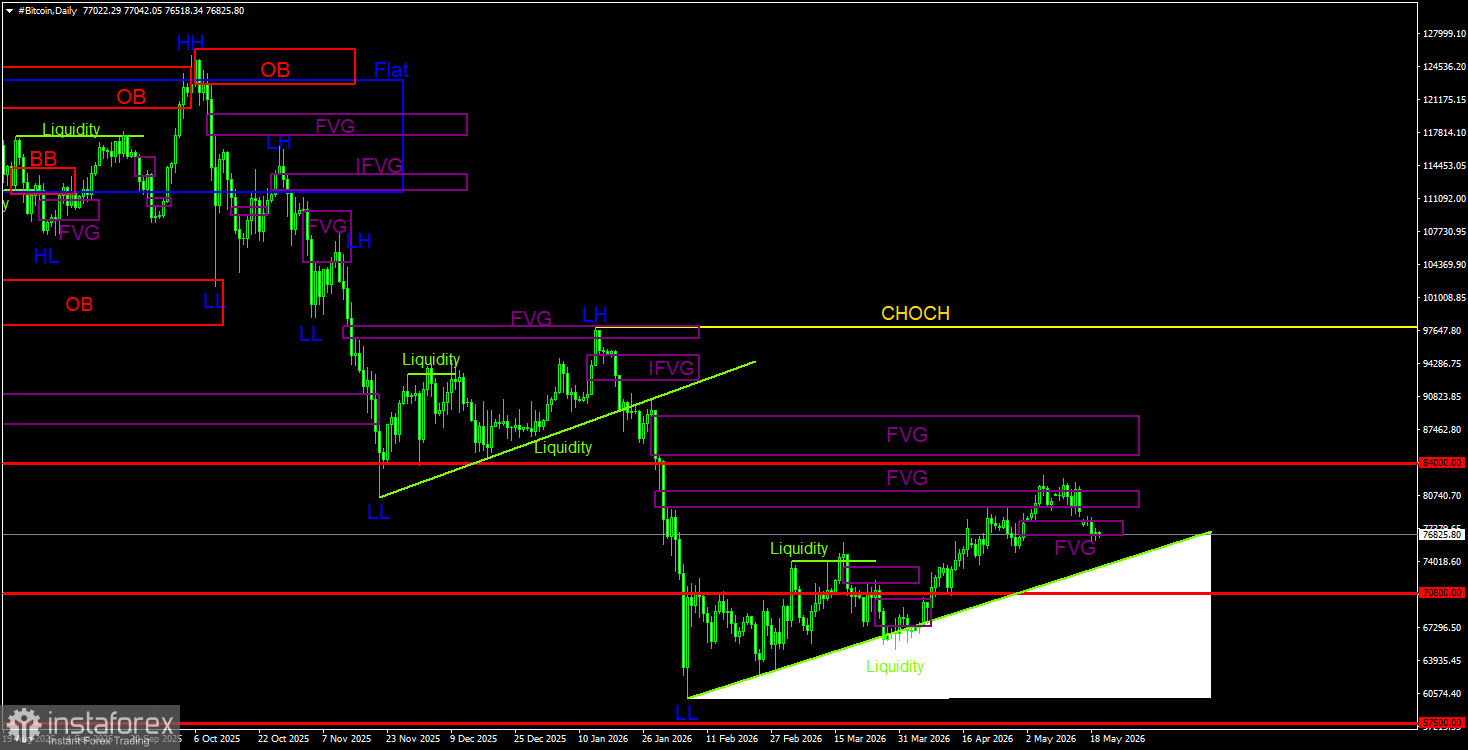
Overall Picture of BTC/USD on 1D
On the daily timeframe, Bitcoin continues to form a downward trend and a correction against it. The trend structure is identified as bearish, and the CHoCH line remains at $97,900. The downward trend can be considered complete only if the price rises above this level. Since there are no signs of a reversal in the upward trend, we believe the decline will resume sooner or later. On the daily timeframe, the nearest POI for sell trades is between $79,500 and $81,100. This area has been tested several times, but the market's reaction has been weak. However, the upward structure has been broken on the hourly timeframe, increasing the likelihood of a further decline in Bitcoin. Currently, there has been no strong reaction to the bullish FVG.
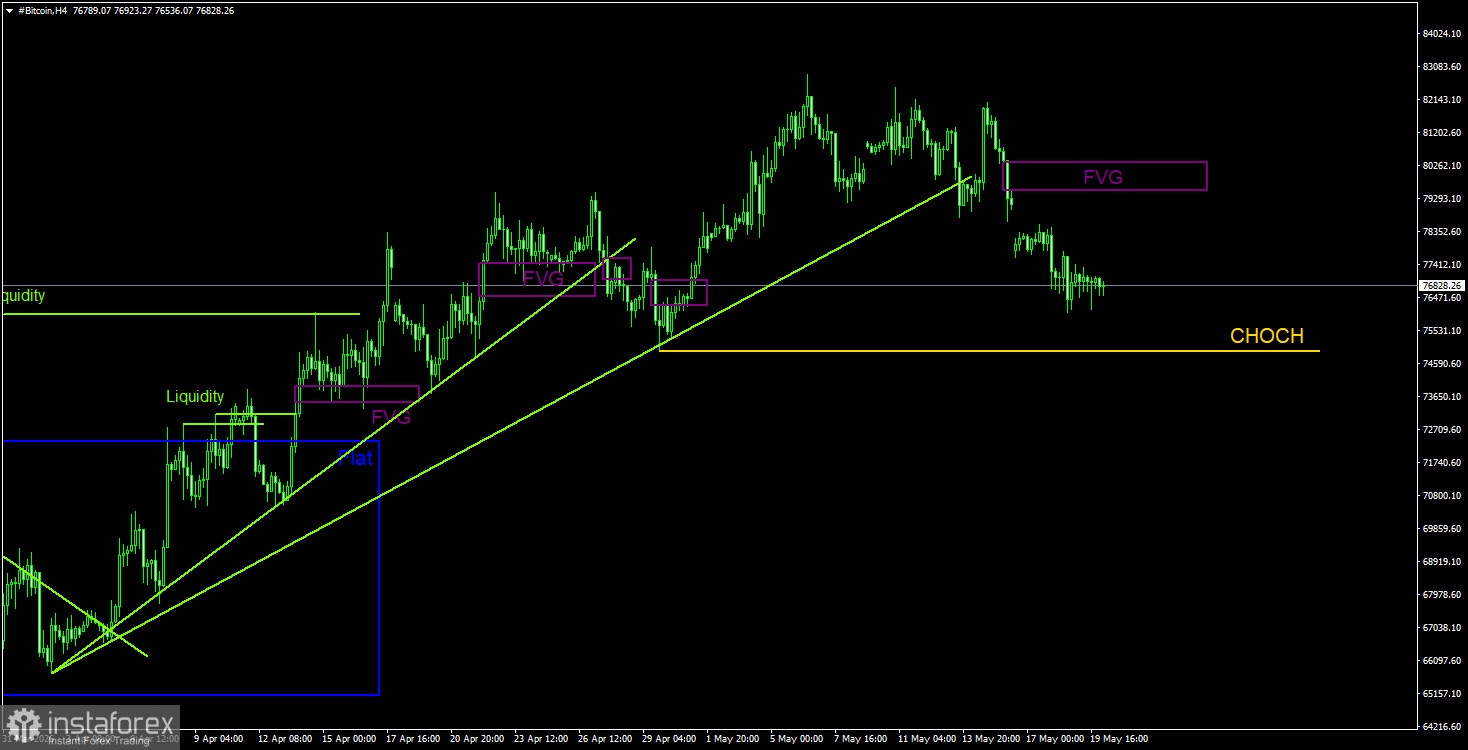
Overall Picture of BTC/USD on 4H
On the 4-hour timeframe, Bitcoin is correcting against its own correction. The CHoCH line of the current upward structure is at $74,950; a consolidation below this level will signal a trend breakdown. This could be a very important signal for the market regarding a trend change. The completion of the upward trend on the 4-hour timeframe could serve as a starting point for a new burst of trend on the daily timeframe. There are still no fundamental grounds for Bitcoin's long-term strengthening, and spot demand remains very weak. Every day, more signals are emerging about the completion of a three-month correction. The only bearish FVG on the 4-hour timeframe may provide an opportunity to open short positions.
Trading Recommendations for BTC/USD:
Bitcoin continues to form a full-fledged downward trend with a correction against it. We continue to expect a decline targeting $57,500 (the 61.8% Fibonacci retracement level from a three-year uptrend), and there are still no signs of the beginning of a long-term upward trend. Currently, the only POI to note is the nearest bearish FVG on the daily timeframe, which is located in the range of $79,300 - $81,200. A sell signal has indeed formed in this area (on the second attempt), which received confirmation on the hourly timeframe. Thus, in the near future, we are inclined to anticipate a resumption of the downward trend, and bearish patterns on the 4-hour timeframe can be used to open short positions.
Explanations for Illustrations:
- CHOCH – change of character in the trend structure.
- Liquidity – Refers to stop losses, pending orders that market makers use to build their positions.
- FVG – Fair Value Gap. Prices move through these areas very quickly, indicating a complete absence of one side in the market. Subsequently, prices tend to return and react to such areas, continuing the main trend.
- IFVG – Inverted Fair Value Gap. After returning to such an area, prices do not react to it, but impulsively break through and then retest from the other side.
- OB – Order Block. A candle on which a market maker opened a position to gather liquidity for forming their own position in the opposite direction.