Analysis of Monday's Trades:
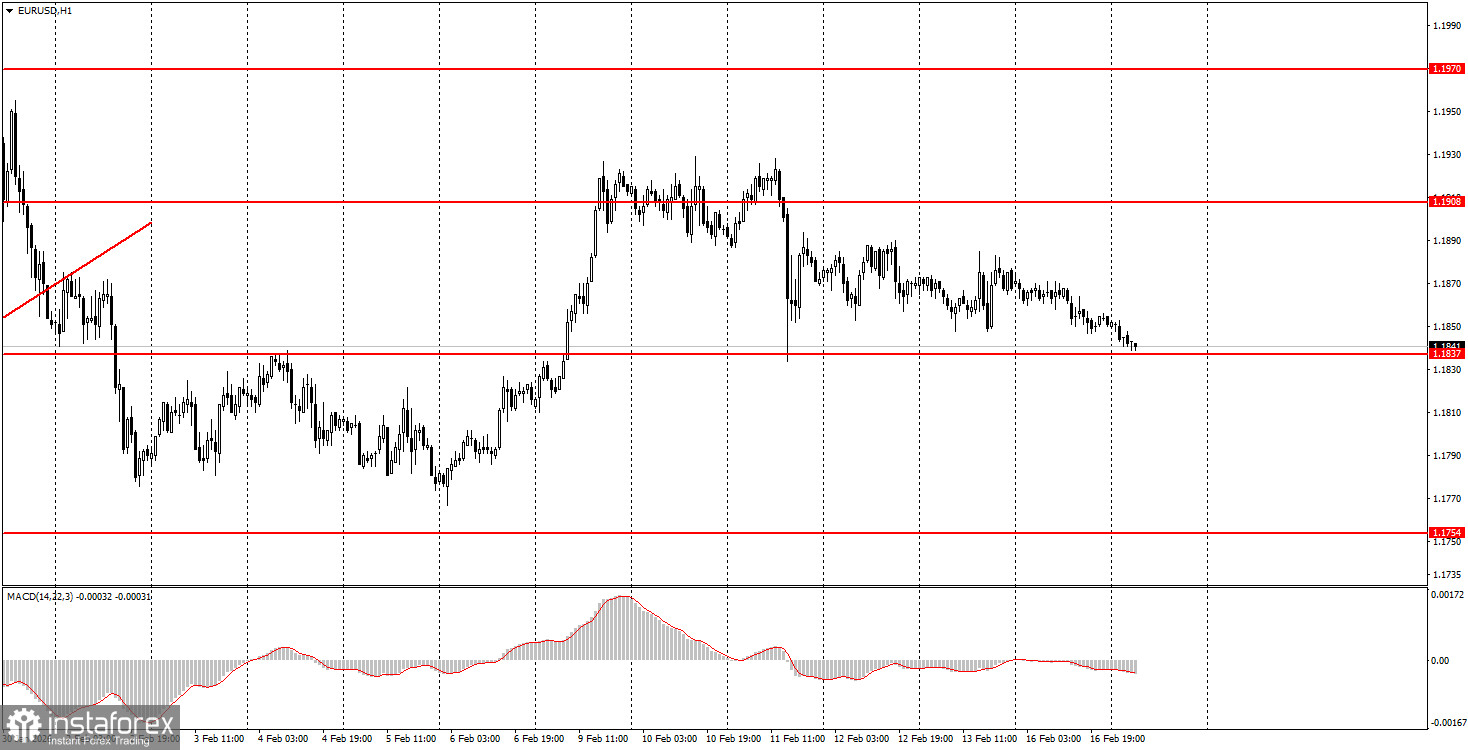
1H Chart of the EUR/USD Pair
The EUR/USD currency pair showed no movement at all on Monday. Volatility this time was below 30 pips, and the European currency gradually slid down at a turtle's pace by exactly those 30 pips during the day. By the end of the day, the pair was around 1.1837. The only macroeconomic and fundamental event to highlight is the Eurozone industrial production report, which, once again, failed to satisfy traders or the euro. However, we have mentioned multiple times that we cannot expect support from European data at this time. The problem is that the U.S. data are even worse and more contradictory. While the European economy has at least stable prospects and the European Central Bank is keeping rates constant, the U.S. economy has uncertain prospects, and the Federal Reserve will, in one way or another, engage in easing. Thus, the outlook for the U.S. dollar remains much worse.
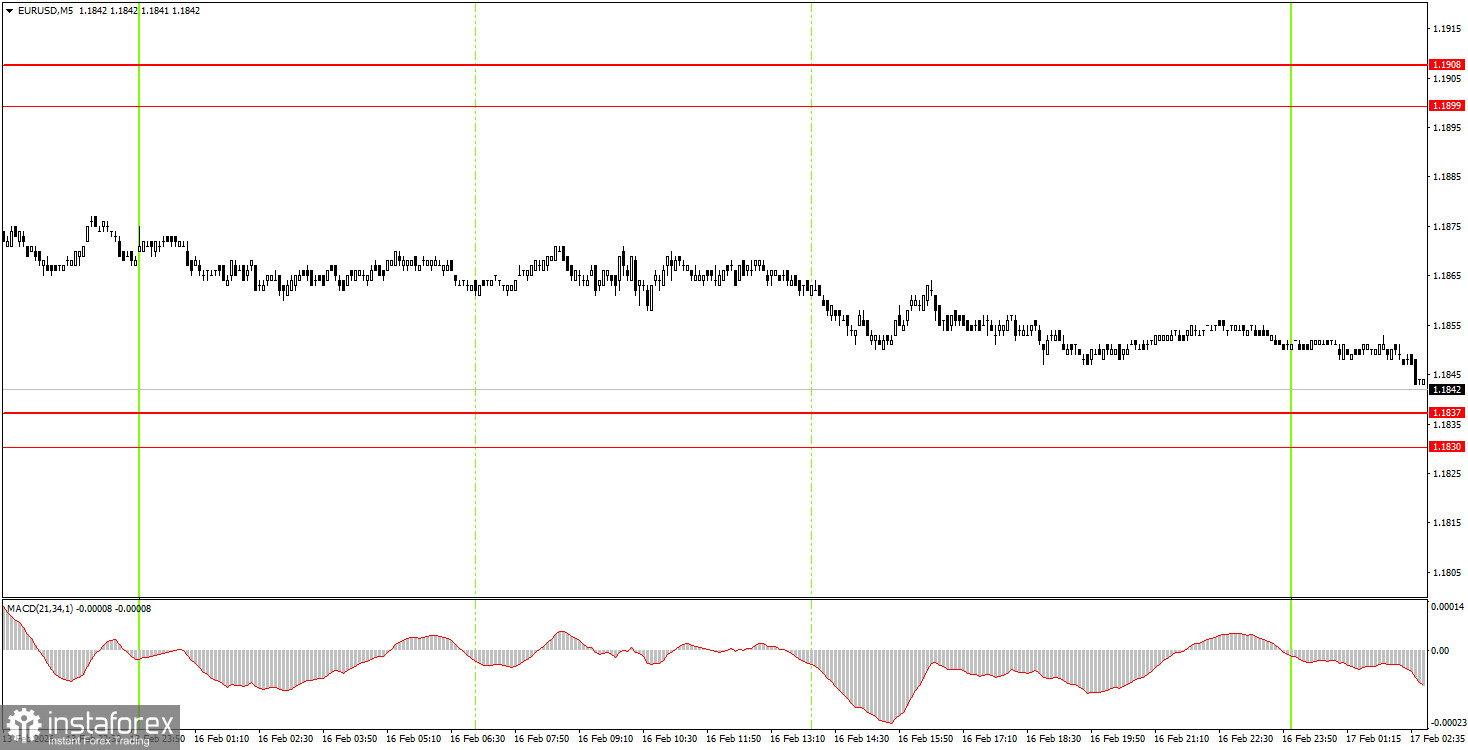
5M Chart of the EUR/USD Pair
On the 5-minute timeframe, no trading signals were formed on Monday. The price throughout the day did not reach any levels or zones, so there was no basis for beginners to open trading positions.
How to Trade on Tuesday:
On the hourly timeframe, the downward correction remains, which may soon revert to an upward movement. Let's remind ourselves that the flat, which lasted for 7 months, has ended. If so, the long-term upward trend has resumed at the beginning of 2026. Therefore, we expect a new medium-term decline in the dollar. The overall fundamental backdrop remains very challenging for the American currency, so we fully support further movement to the upside. Currently, the market is in another pause.
On Tuesday, beginner traders may consider short positions if the price consolidates below the 1.1830-1.1837 area, with a target in the 1.1745-1.1754 area. A bounce from the area of 1.1830-1.1837 will allow traders to open long positions with a target of 1.1899-1.1908.
On the 5-minute timeframe, levels to consider include 1.1455-1.1474, 1.1527-1.1531, 1.1550, 1.1584-1.1591, 1.1655-1.1666, 1.1745-1.1754, 1.1830-1.1837, 1.1899-1.1908, 1.1970-1.1988, 1.2044-1.2056, 1.2092-1.2104.
Today, in the Eurozone, reports on inflation in Germany and the ZEW economic sentiment indices will be published. We consider these reports secondary and do not expect a strong market reaction. In the U.S., there will also be a relatively insignificant ADP labor market report (weekly).
Main Rules of the Trading System:
- The strength of the signal is determined by the time it takes to form (rebound or breaking through the level). The shorter the time, the stronger the signal.
- If two or more trades were opened around a particular level based on false signals, all subsequent signals from that level should be ignored.
- In a flat market, any pair can generate numerous false signals or no signals at all. In any case, it is best to stop trading at the first signs of a flat.
- Trades are opened during the time period between the start of the European session and until the middle of the American session, after which all trades should be manually closed.
- On the hourly timeframe, signals from the MACD indicator should ideally be traded only when there is good volatility and a trend confirmed by a trend line or channel.
- If two levels are too close to each other (ranging from 5 to 20 pips), they should be considered as a support or resistance area.
- After moving 15 pips in the correct direction, it is advisable to set the Stop Loss to break-even.
What's on the Charts:
- Support and resistance levels are targets for opening buy or sell trades. Take Profit levels can be placed around them.
- Red lines indicate channels or trend lines that reflect the current trend and indicate the preferred direction for trading now.
- The MACD indicator (14,22,3) – the histogram and signal line – serves as a supplementary indicator that can also be used as a source of signals.
- Important speeches and reports (always found in the news calendar) can significantly influence the movement of the currency pair. Therefore, during their release, trading should be conducted with maximum caution, or it is advised to exit the market to avoid a sharp price reversal against the preceding movement.
- Beginners trading in the Forex market should remember that not every trade can be profitable. Developing a clear strategy and practicing sound money management are the keys to long-term trading success.