Trade Analysis for Tuesday:
1-Hour Chart of the GBP/USD Pair
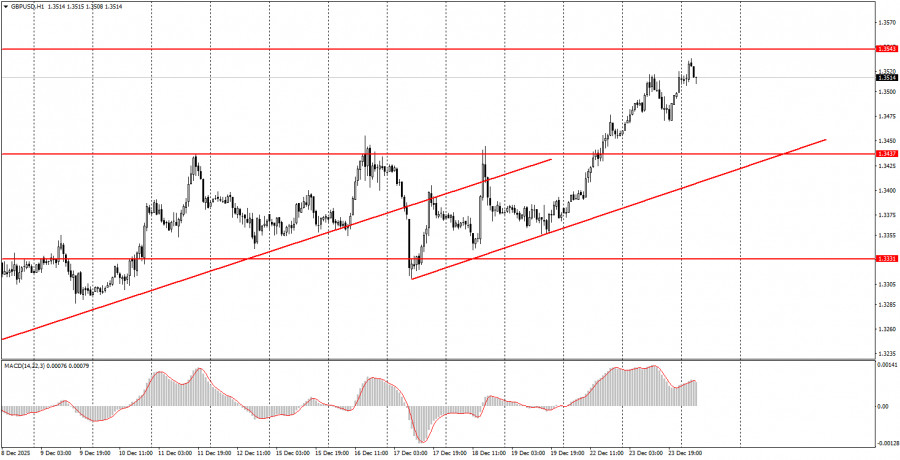
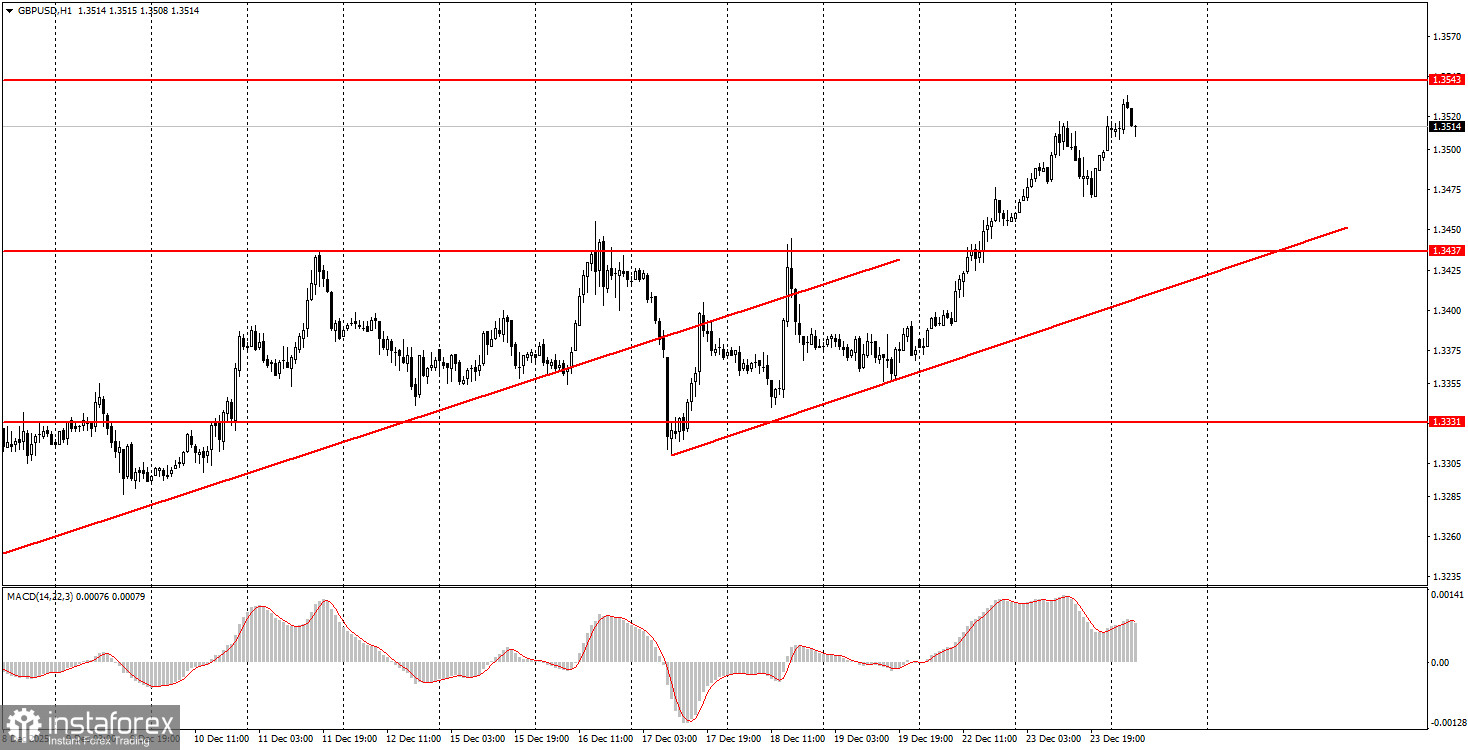
The GBP/USD pair continued its upward movement on Tuesday for most of the day. It is worth noting that the only events that could have affected trader sentiment were published in the US. These include reports on industrial production, third-quarter GDP, and durable goods orders. GDP grew by 4.3%, which significantly exceeded forecasts, but industrial production fell by 0.1%, and durable goods orders declined by 2.2%. Thus, we continue to witness a paradox: the US economy is growing, yet most other macroeconomic indicators are declining. This situation is perhaps only possible under Donald Trump. The market clearly understands that current GDP growth is not a reliable indicator, and it is certainly not a reason to buy the US dollar. Therefore, the dollar's growth following the data release lasted only a couple of hours, and then the initiative was once again taken by the British pound. A new ascending trend line formed on the hourly timeframe, and we believe that the upward trend has resumed in the medium term.
5-Minute Chart of the GBP/USD Pair
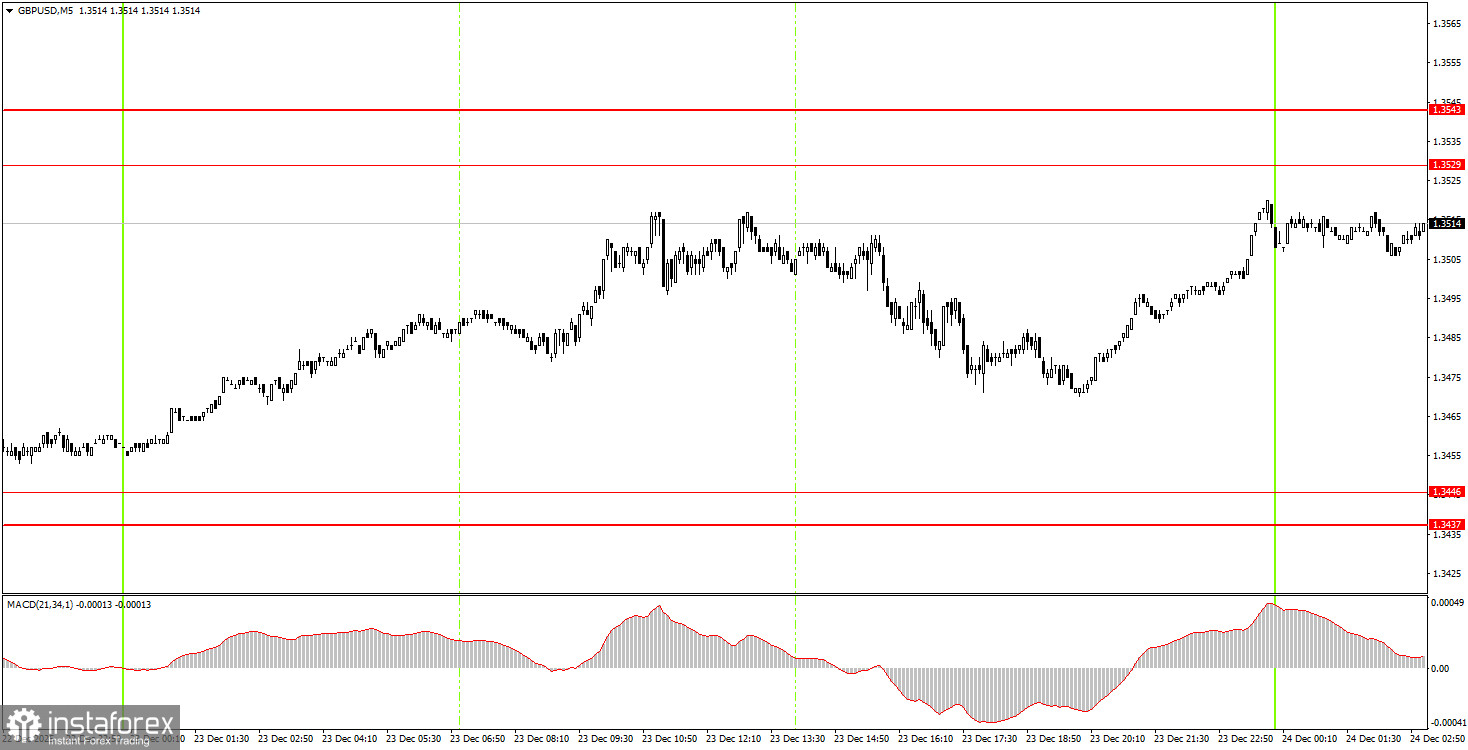
On the 5-minute timeframe, no new trading signals were generated on Tuesday. The last trading signal was formed on Monday evening when the area of 1.3437-1.3446 was broken. Last night, the target area of 1.3529-1.3543 was reached. A bounce from this area could provoke a small decline in the pair.
How to Trade on Wednesday:
On the hourly timeframe, the GBP/USD pair has completed its flat phase and is resuming its upward move. We fully support this scenario, as we have repeatedly stated. There are no global grounds for medium-term dollar growth, so we only expect upward movement. Overall, we anticipate the resumption of the global upward trend in 2025, which may push the pair to the 1.4000 mark within the next couple of months.
On Wednesday, novice traders may look to open new long positions if the price breaks above the 1.3529-1.3543 area, targeting 1.3574-1.3590. Short positions will become relevant if there is a bounce from the area of 1.3529-1.3543, with a target around 1.3437-1.3446.
Key Levels to Monitor on the 5-Minute Chart: 1.2913, 1.2980-1.2993, 1.3043, 1.3096-1.3107, 1.3203-1.3212, 1.3259-1.3267, 1.3319-1.3331, 1.3437-1.3446, 1.3529-1.3543, 1.3574-1.3590. On Wednesday, there are no significant events scheduled in the UK or the US, but the market is ready to trade even ahead of Christmas and the New Year. The market is currently "thin," making it easier for market makers to move prices than in regular conditions.
Key Rules of the Trading System:
- The strength of a signal is assessed by the time it takes to form the signal (bounce or breakout). The less time it takes, the stronger the signal.
- If two or more trades were opened near any level based on false signals, all subsequent signals from that level should be ignored.
- In a flat, any pair can create numerous false signals or none at all. In any case, it's better to stop trading at the first signs of a flat.
- Trades are opened during the period between the start of the European session and the middle of the American session, after which all trades must be closed manually.
- On the hourly timeframe, when trading based on signals from the MACD indicator, it is preferable to trade only when good volatility is present, and a trend is confirmed by a trend line or channel.
- If two levels are positioned too closely to each other (5 to 20 points), they should be viewed as a support or resistance area.
- After moving 20 pips in the right direction, set the Stop Loss to breakeven.
Chart Explanation:
- Support and Resistance Levels: Levels that serve as targets for opening buys or sells. Take Profit levels can be placed near them.
- Red Lines: Channels or trend lines that reflect the current trend and indicate the preferred direction for trading.
- MACD Indicator (14, 22, 3): A histogram and signal line, a supplementary indicator that can also be used as a source of signals.
Important Note: Significant speeches and reports (always included in the news calendar) can greatly influence the movement of the currency pair. Therefore, during their release, it is advisable to trade cautiously or exit the market to avoid sharp reversals against the preceding movement.
Remember: For beginners trading in the Forex market, it is important to understand that not every trade can be profitable. Developing a clear strategy and practicing money management are keys to long-term trading success.