Trade Analysis for Thursday:
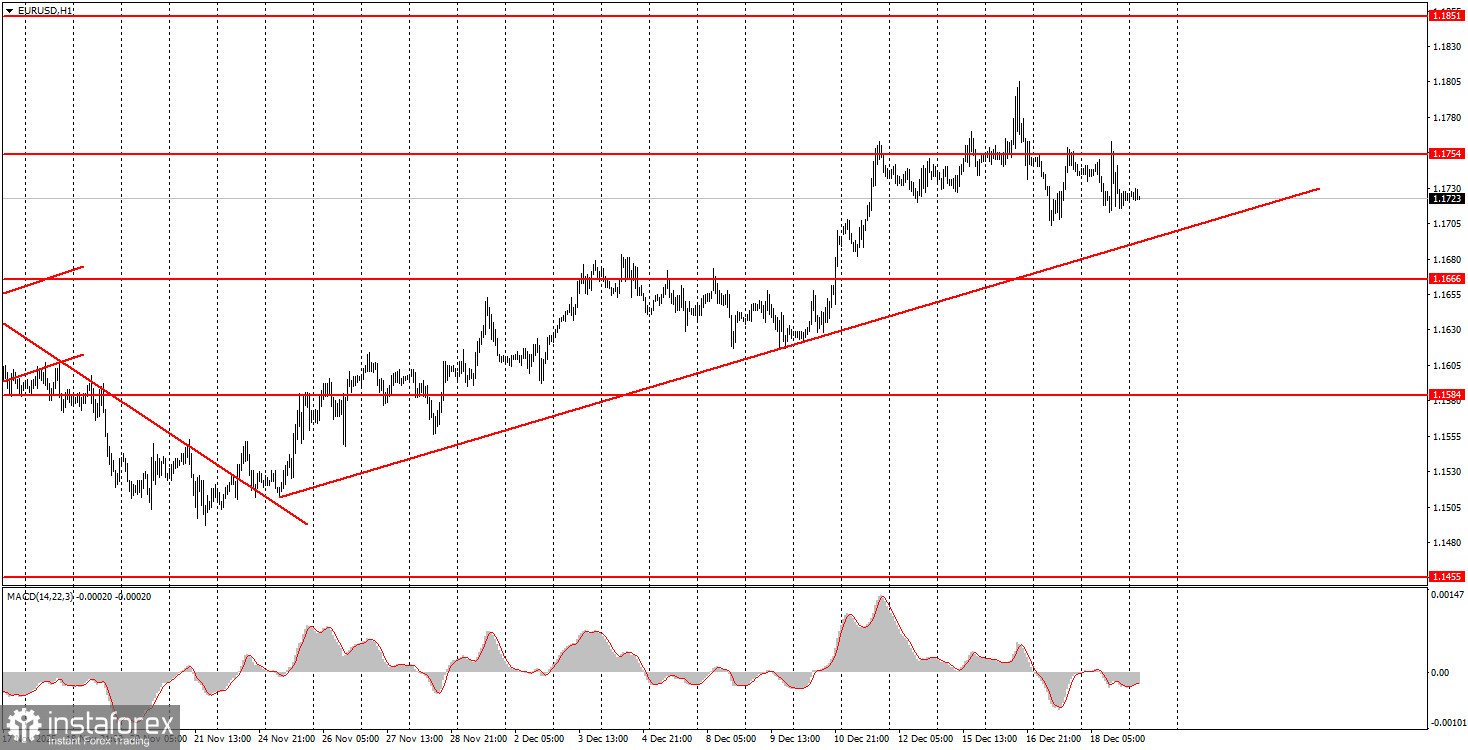
1H Chart of the EUR/USD Pair
The EUR/USD currency pair moved in various directions on Thursday, but it was not particularly volatile. Overall, this week has been more disappointing than rewarding, in many respects. First, the market movements leave much to be desired. Many traders likely expected to see a trend and high volatility, but what they got instead was more of a flat market. Secondly, the macroeconomic background clarified some issues but failed to answer key questions. Notably, this week saw the release of the long-awaited reports on U.S. unemployment and the labor market, as well as an inflation report. Inflation has started to slow, but questions remain about the labor market, as unemployment continues to rise while Non-Farm Payrolls are beginning to show signs of recovery. We believe it is essential to base decisions on the overall picture. In our view, the global fundamental backdrop has not changed this week, so we expect further dollar declines. Any growth in the US currency will be perceived as a correction. This does not mean that short positions are prohibited; rather, a rise in the EUR/USD pair remains far more likely.
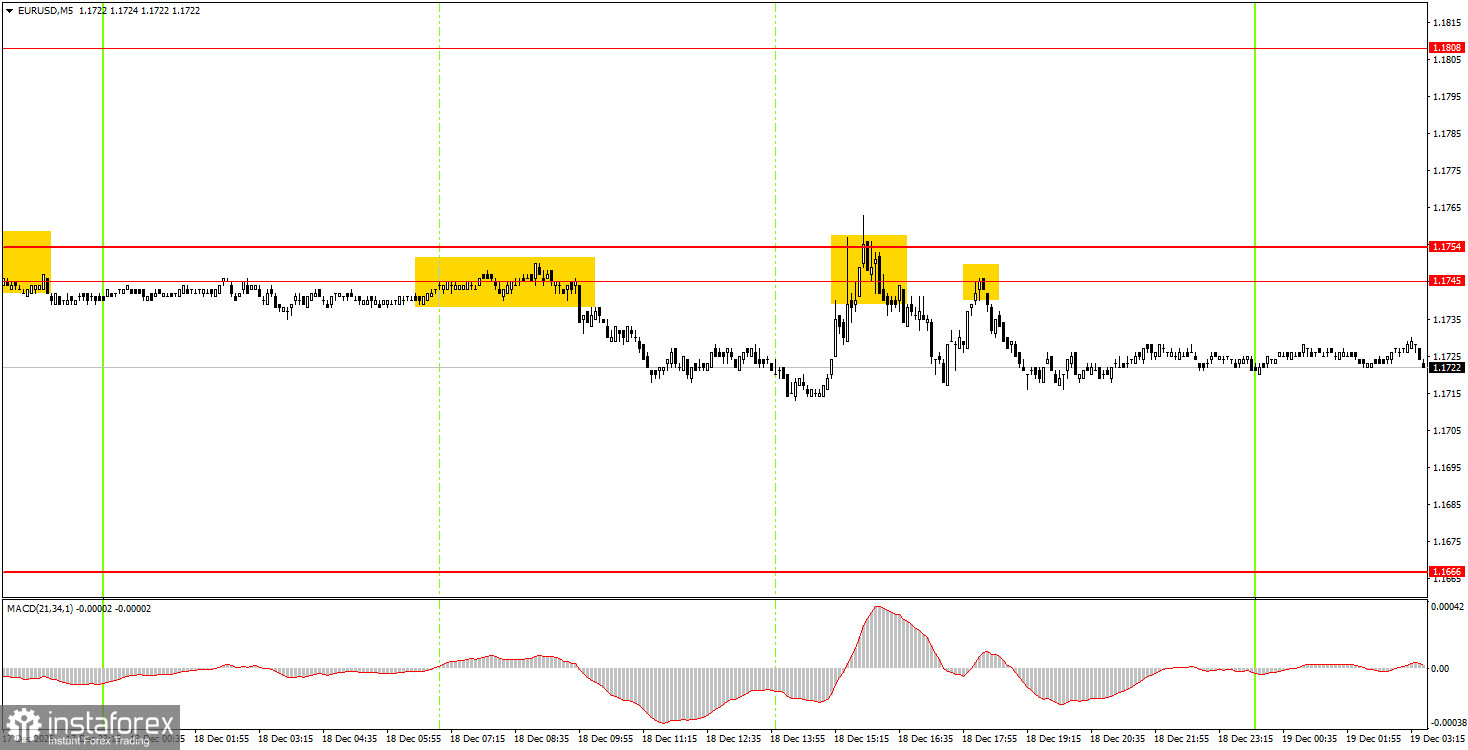
5M Chart of the EUR/USD Pair
On the 5-minute time frame, the pair traded sideways throughout Thursday, bouncing three times between 1.1745 and 1.1754. In each of these three instances, the price fell by approximately 20-25 pips. The overall volatility for the day was around 50 pips, despite two central bank meetings and a crucial U.S. inflation report.
How to Trade on Friday:
On the hourly time frame, the EUR/USD pair continues to form an upward trend. The fundamental and macroeconomic background remains very weak for the U.S. dollar, suggesting further gains for the pair. The price has reached the upper line of the sideways channel at 1.1400-1.1830, so it now needs either to break through it, or the flat trend will persist.
On Friday, novice traders can once again trade from the area of 1.1745-1.1754. A bounce from this area will allow for the opening of short positions with a target at 1.1655-1.1666. A consolidation above this area would suggest long positions with a target at 1.1808.
On the 5-minute time frame, levels to consider include 1.1354-1.1363, 1.1413, 1.1455-1.1474, 1.1527-1.1531, 1.1550, 1.1584-1.1591, 1.1655-1.1666, 1.1745-1.1754, 1.1808, 1.1851, 1.1908, and 1.1970-1.1988. There are no significant events scheduled in the Eurozone on Friday, while in the U.S., the University of Michigan consumer sentiment index will be released. Yesterday, the volatility during three much more important events was just 50 pips. What to expect today? That's a rhetorical question.
Key Rules of the Trading System:
- The strength of a signal is determined by the time it takes to form the signal (bounce or breakout). The less time required, the stronger the signal.
- If two or more trades were opened near any level based on false signals, all subsequent signals from that level should be ignored.
- In a flat, any pair may form numerous false signals or none at all. At the first signs of a flat, it is better to stop trading.
- Trades are opened during the period between the beginning of the European session and the middle of the American session, after which all trades should be closed manually.
- On the hourly timeframe, it is preferred to trade only when there is good volatility and a trend confirmed by the trend line or channel, using signals from the MACD indicator.
- If two levels are too close to each other (5 to 20 pips), they should be viewed as a support or resistance area.
- Upon moving 15 pips in the right direction, set the Stop Loss to breakeven.
Chart Explanations:
- Support and Resistance Levels: Levels that serve as targets for opening buys or sells. Take Profit levels can be placed near them.
- Red Lines: Channels or trend lines that reflect the current trend and indicate the preferred direction for trading.
- MACD Indicator (14, 22, 3): A histogram and signal line; a supplementary indicator that can also be used as a source of signals.
Important Note: Significant speeches and reports (always included in the news calendar) can greatly influence the movement of the currency pair. Therefore, during their release, it is advisable to trade cautiously or exit the market to avoid sharp reversals against the preceding movement.
Remember: For beginners trading in the Forex market, it is important to understand that not every trade can be profitable. Developing a clear strategy and practicing money management are keys to long-term trading success.