Top.Mail.Ru
empty
07.11.2024 08:24 PM
Analysis of GBP/USD on November 7, 2024

This image is no longer relevant

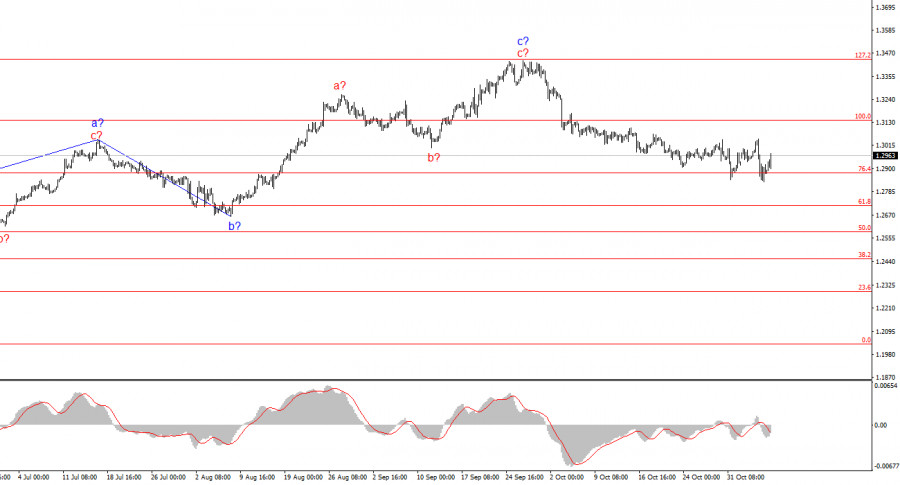
The wave structure of GBP/USD remains complex and continues to evolve into a more extended pattern. At present, there is a strong likelihood that a downward trend is beginning, as the successful breakout of wave b's low within wave c indicates the market's readiness to form not merely an individual wave but a sustained trend.

Since April 22, a series of a-b-c waves has been observed, with smaller a-b-c waves nested within them. Considering the wave structure of EUR/USD, which suggests the formation of a downward wave set, the current conditions present a favorable opportunity to initiate a new trend. If this assumption holds true, the first wave of this trend is currently in development.

The pound continues to be influenced by the Bank of England, which has been hesitant to reduce rates. However, the monetary policies of the Bank of England and the Federal Reserve in the coming months may not favor a weaker U.S. dollar. The market has long anticipated a rate reduction by the Federal Reserve, pushing the dollar to its lowest levels. At this stage, I anticipate a strengthening of the U.S. dollar.

The Pound Responds Positively to the "Basic" Rate Reduction

The GBP/USD pair rose by 90 basis points on Thursday, which seems rather peculiar. However, this week has already seen a series of unusual market movements. These movements began last Friday when demand for the U.S. dollar surged despite a disappointing Nonfarm Payrolls report. On Monday, the market showed some signs of stabilization. By Wednesday, however, Donald Trump's victory in the U.S. presidential election triggered a dollar rally. For the remainder of Wednesday and throughout Thursday, the market appeared to stabilize the U.S. dollar's exchange rate.

There are no clear reasons for the immediate strengthening of the dollar following Trump's victory, nor are there compelling explanations for the pound gaining strength amid the Bank of England's monetary easing measures. Since last Friday, market movements have aligned with the ongoing wave structure but show a weak correlation with the current news context.

Earlier today, it was announced that the Bank of England has implemented a second round of easing and is prepared to continue cutting rates if the downward inflation trajectory persists. At the same time, Andrew Bailey projected that inflation might accelerate by the end of the year, as earlier declines in oil prices likely contributed to slower price growth. However, the Bank of England remains focused on the overall inflation trajectory. If inflation continues to decline, monetary easing will proceed without pause. In my opinion, the market could develop a more robust corrective structure before initiating a new impulsive wave.

This image is no longer relevant

General Conclusions

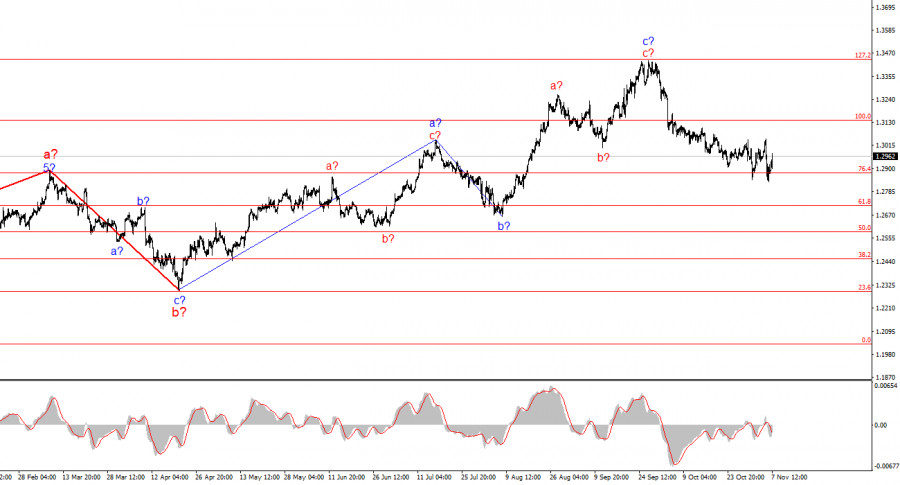
The wave structure of GBP/USD remains intricate. The current structure suggests that the trend segment from April 22 may have taken the form of an a-b-c wave pattern, which would indicate its completion. From the 1.3440 level, corresponding to 127.2% on the Fibonacci scale, traders could have begun opening short positions gradually. At this point, it may be prudent to wait for a corrective upward wave before attempting to sell the pair again. Nevertheless, the decline may persist for an extended duration within the first wave, which is almost certainly impulsive. Yesterday, I highlighted 1.2800 as a potential target, and prices have already reached 1.2832.

On a larger wave scale, the wave structure has transformed. It now appears that a complex and extended upward corrective structure is forming. At present, this structure resembles a three-wave pattern, but it may evolve into a five-wave formation, which could take several months or longer to fully develop.

Key Principles of My Analysis:

  1. Wave structures should be straightforward and easy to interpret. Complex structures are challenging to trade and are often prone to revisions.
  2. If there is uncertainty about the market direction, it is better to stay out.
  3. Absolute certainty in market movement is impossible. Always use protective Stop Loss orders.
  4. Wave analysis can be effectively combined with other analytical methods and trading strategies.
Chin Zhao,
انسٹافاریکس کا تجزیاتی ماہر
© 2007-2025
Summary
Urgency
Analytic
Alexander Dneprovskiy
Start trade
انسٹافاریکس کے ساتھ کرپٹو کرنسی کی معاملاتی تبدیلیوں سے کمائیں۔
میٹا ٹریڈر 4 ڈاؤن لوڈ کریں اور اپنی پہلی ٹریڈ کھولیں۔
  • Grand Choice
    Contest by
    InstaForex
    InstaForex always strives to help you
    fulfill your biggest dreams.
    مقابلہ میں شامل ہوں

تجویز کردہ مضامین

یورو / یو ایس ڈی کا تجزیہ برائے 12 اگست 2025

یورو / یو ایس ڈی کے 4 گھنٹے کے چارٹ پر لہر کا ڈھانچہ کئی مہینوں سے بدستور برقرار ہے، جو بہت حوصلہ افزا ہے۔ یہاں تک کہ جب اصلاحی

Chin Zhao 20:50 2025-08-12 UTC+2

جی بی پی / یو ایس ڈی کا تجزیہ برائے 12 اگست 2025

جی بی پی / یو ایس ڈی کے لیے، لہر کا ڈھانچہ بلش امپلس ویو پیٹرن کی تشکیل کی نشاندہی کرتا رہتا ہے۔ لہر کی تصویر تقریباً یورو

Chin Zhao 20:37 2025-08-12 UTC+2

یورو / یو ایس ڈی تجزیہ برائے 31 جولائی 2025

یورو / یو ایس ڈی کے لیے 4 گھنٹے کے چارٹ پر لہر کا نمونہ کئی مہینوں سے بدستور برقرار ہے۔ رجحان کا اوپر کی طرف حصہ بننا جاری ہے،

Chin Zhao 21:10 2025-07-31 UTC+2

جی بی پی / یو ایس ڈی کا تجزیہ برائے 31 جولائی 2025

جی بی پی / یو ایس ڈی کے لیے لہر کا نمونہ تیزی کے تسلسل کی لہر کے ڈھانچے کی ترقی کی نشاندہی کرتا ہے۔ لہر کی ترتیب یورو

Chin Zhao 21:05 2025-07-31 UTC+2

جولائی 29 کو یورو / یو ایس ڈی: بلز مارکیٹ کو 1.189 کی سطح کی طرف دھکیل سکتے ہیں

طویل مدت میں، یورو / یو ایس ڈی مارکیٹ ایک بڑی تیزی کی اصلاح (بی) تشکیل دے رہی ہے، جو معیاری اے بی سی زگ زیگ کی شکل اختیار

Roman Onegin 19:06 2025-07-29 UTC+2

یورو / یو ایس ڈی کا تجزیہ برائے 17 جولائی 2025

یورو / یو ایس ڈی کے لیے 4 گھنٹے کے چارٹ پر لہر کا پیٹرن مسلسل کئی مہینوں سے غیر تبدیل شدہ ہے۔ اوپر کی طرف رجحان والے

Chin Zhao 21:57 2025-07-16 UTC+2

جولائی 16 2025 کو جی بی پی / یو ایس ڈی تجزیہ

جی بی پی / یو ایس ڈی کے لیے لہر کا پیٹرن بلش امپلس ویو پیٹرن کی تشکیل کی نشاندہی کرتا ہے۔ لہر کی ترتیب تقریباً یورو

Chin Zhao 21:53 2025-07-16 UTC+2

یورو / یو ایس ڈی کا تجزیہ برائے 30 جون 2025

یورو / یو ایس ڈی کے لیے 4 گھنٹے کے چارٹ پر لہر کا پیٹرن اوپر کی طرف رجحان والے حصے کی تشکیل کی نشاندہی کرتا ہے۔ 28 فروری تک،

Chin Zhao 20:17 2025-06-30 UTC+2

جی بی پی / یو ایس ڈی : تجزیہ اور پیشن گوئی

جی بی پی / یو ایس ڈی کے لیے لہر کا پیٹرن اوپر کی طرف آنے والی لہر کے پیٹرن کی تشکیل کی تجویز کرتا ہے۔ لہر کی تصویر تقریباً

Chin Zhao 20:14 2025-06-30 UTC+2

یورو / یو ایس ڈی کا تجزیہ برائے 23 جون 2025

یہ کہ 4 گھنٹے کے یورو / یو ایس ڈی چارٹ کا لہر پیٹرن اوپر کی طرف رجحان والے حصے کی ترقی کی نشاندہی کرتا ہے۔ یہ تبدیلی

Chin Zhao 19:35 2025-06-23 UTC+2
ابھی فوری بات نہیں کرسکتے ؟
اپنا سوال پوچھیں بذریعہ چیٹ.
Widget callback
 

Dear visitor,

Your IP address shows that you are currently located in the USA. If you are a resident of the United States, you are prohibited from using the services of InstaFintech Group including online trading, online transfers, deposit/withdrawal of funds, etc.

If you think you are seeing this message by mistake and your location is not the US, kindly proceed to the website. Otherwise, you must leave the website in order to comply with government restrictions.

Why does your IP address show your location as the USA?

  • - you are using a VPN provided by a hosting company based in the United States;
  • - your IP does not have proper WHOIS records;
  • - an error occurred in the WHOIS geolocation database.

Please confirm whether you are a US resident or not by clicking the relevant button below. If you choose the wrong option, being a US resident, you will not be able to open an account with InstaForex anyway.

We are sorry for any inconvenience caused by this message.