 Stay
Stay 

Trading Conditions
Products
Tools


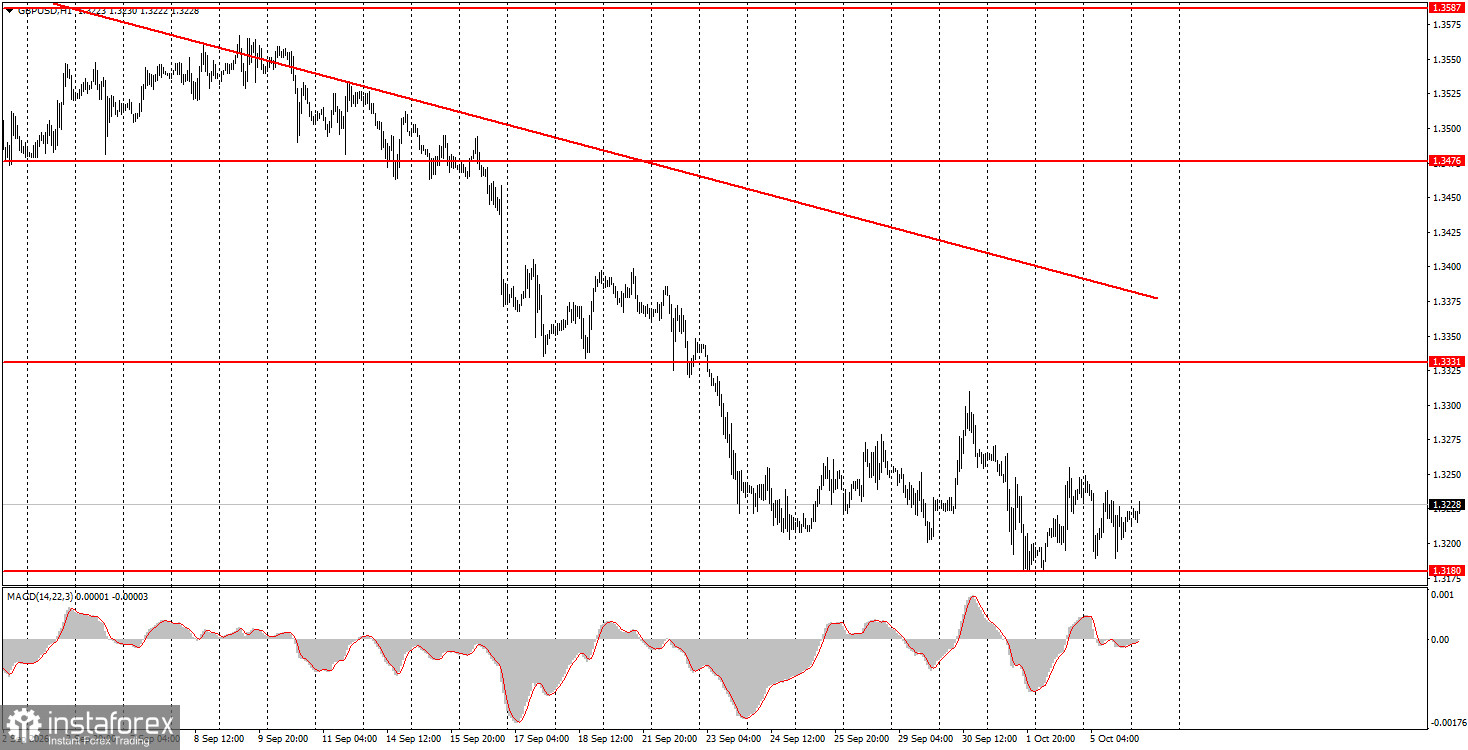
The GBP/USD pair on Monday also tried to continue moving south, but the pound once again held up from a sharper fall, unlike the euro. Yesterday the US ISM services activity index for September was published, but that print was not the day's main event for traders. The ISM came in below forecasts and therefore reasonably triggered a small dip in the dollar. The problem is that the dollar now shows only a modest decline, even when there are reasons for a larger move. Recall that on Friday the Nonfarm Payrolls and unemployment reports should have triggered a dollar collapse — they were poor readings and essentially undermined hawkish Federal Reserve prospects for October. If the labor market continues to slow and unemployment rises, the Fed could even abandon further tightening in December. Yet the market has not priced that in so far. The pound shows more resilience than the euro, but it is also drifting lower overall.
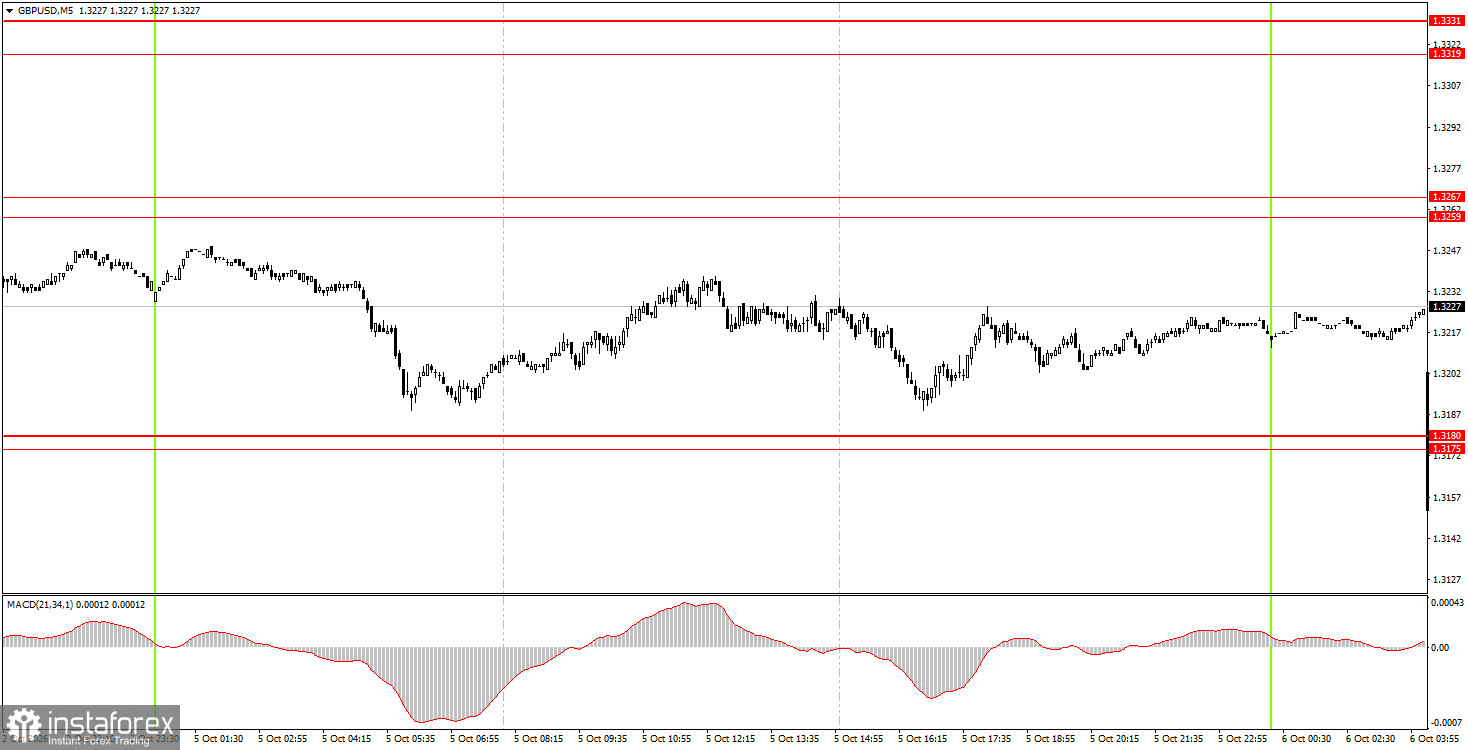
On the 5-minute TF on Monday, no trade signals were formed. Price twice approached the 1.3175–1.3180 area but did not react, even within a margin. Traders had no valid reasons to open positions.
On the hourly TF, GBP/USD continues a downward trend that has become a full-fledged, powerful move. The fundamental backdrop for the dollar improved because the Federal Reserve signaled it was ready to continue tightening monetary policy. However, two and a half weeks have passed since then, and the market still buys the dollar aggressively. Therefore, we strongly doubt that Fed policy alone explains this. We view the current movement as illogical, inertia-driven, and speculative.
On Tuesday, novice traders can consider short positions targeting 1.3175–1.3180 if price rebounds from the 1.3259–1.3267 area. Open long positions with targets of 1.3259–1.3267 if price rebounds from the 1.3175–1.3180 area.
On the 5-minute TF you can trade the levels 1.3043, 1.3096–1.3107, 1.3175–1.3180, 1.3259–1.3267, 1.3319–1.3331, 1.3380–1.3386, 1.3456–1.3476, 1.3587–1.3598, 1.3631–1.3641. No important events are scheduled in the UK on Tuesday, and in the US only the weekly ADP report is due, which we regard as of little interest. Thus, volatility may be lower today, but keep in mind the market remains biased toward buying the dollar.
Price levels (areas) of support and resistance serve as targets for opening buy or sell trades or as sources of signals.
Red lines indicate channels or trend lines that show the current trend and the preferred trading direction.
The MACD indicator (14,22,3) — the histogram and signal line — is an auxiliary indicator that can also provide signals.
Important speeches and reports (listed in the news calendar) can significantly influence currency pair movements. Therefore, during their release, traders should approach trading with utmost caution, or exit the market to avoid sudden reversals against the preceding move.
Beginner forex traders should remember that not every trade can be profitable. Developing a clear strategy and practicing money management are key to long-term success in trading.
InstaForex analytical reviews will make you fully aware of market trends! Being an InstaForex client, you are provided with a large number of free services for efficient trading.


