 Permanecer

Condiciones de negociación
Products
Herramientas


Bitcoin is holding around $86,000, and Ether trades above $2,700. On Friday, the price approached $87,000 — roughly $500 below the September peak — then pulled back below $86,000; this is already the second rise this week to fade. Against this pause the chart is forming a signal that hasn't appeared for over a year.
I'm referring to the 50-, 100- and 200-day simple moving averages. A full bullish alignment means the 50-day sits above the 100-day, and the 100-day above the 200-day. This alignment is the first since June 2025. Note that the previous alignment lasted 97 days, and during that period Bitcoin rose only from $106,000 to $112,000.
The signal does not guarantee a rally, and history shows that. In October 2020 the alignment formed near $13,600 and lasted until May 2021, when Bitcoin rose above $64,000. In early November 2023, it confirmed and held until May 2024, during which price more than doubled — roughly from $35,000 to $73,000. But in June 2024 the same pattern lasted only 20 days, after which Bitcoin lost about 10%. Of four historical cases, two delivered gains, and two were traps for traders who bought the signal itself.
The main threat to the signal today is not the moving averages but the dollar. Bitcoin's 40% rise to $87,000 in Q3 stalled near $85,000 as the dollar and Treasury yields climbed. Recall that the weak US employment report on October 2 supported Bitcoin via rising odds of a Federal Reserve pause, giving buyers some buffer — but that does not guarantee a sustained bull rally. I believe dollar behavior and the bond market, not the crossing of two lines, will decide whether the current structure becomes a durable bull trend.
As long as Bitcoin stays above $85,000 I expect another attempt at $87,600, and a close above that would open the way to $90,000. A return below $85,000 would bring the price back into the September range and reduce the bullish alignment's significance.
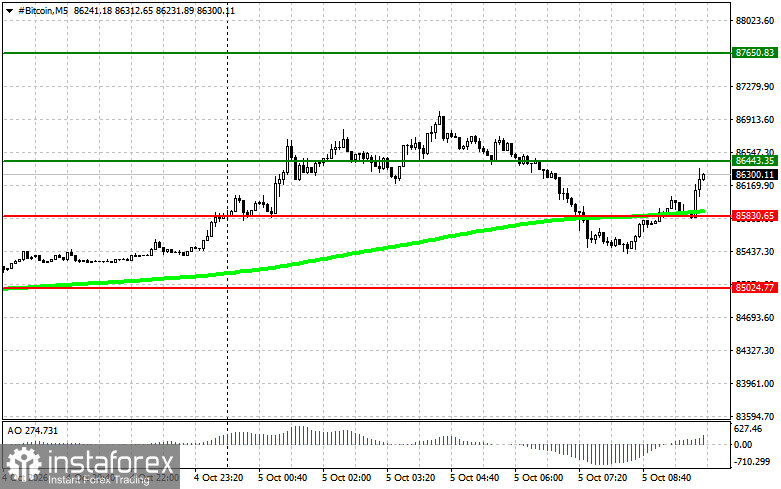
Bitcoin is trading inside a narrow range between support at 85,800 and resistance at 86,400, with outer boundaries at 85,000 and 87,600, and the plan is built around two mirrored directions with a full set of breakout and rejection scenarios. There are two entries for buying. First: a confirmed breakout of 86,400 to the upside — buy targeting 87,600, where I take profit and consider a short on the retracement, provided price is above the 50-day moving average and the Awesome Oscillator is above zero. Second: a rejection off 85,800 if the downside breakout fails and the spike was false — buy for a return first to 86,400 and then to 87,600.
Sell positions are symmetric. On a confirmed breakdown of 85,800 to the downside, consider a short targeting 85,000, provided the moving average is above price and the Awesome Oscillator is below zero. If an upside breakout of 86,400 fails and price returns below that level, short from resistance aiming back to 85,800 and then 85,000. For reference, the 50-day moving average is around 79,495, so at the current price level shorts remain counter-trend.
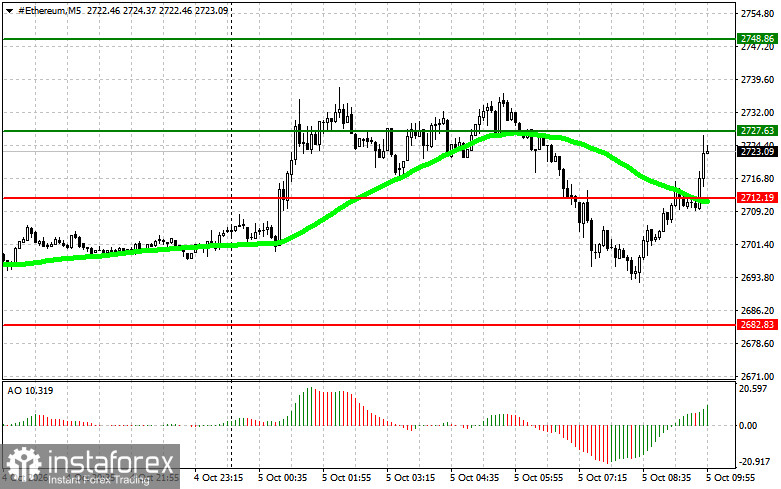
For Ether the logic fully mirrors Bitcoin on its own price scale: the inner range is between support 2,712 and resistance 2,727, with outer boundaries at 2,682 and 2,748. Buy on a confirmed breakout above 2,727 to the upside, targeting 2,748, where profit is taken and a short on the pullback may be considered; conditions are the same—price above the 50-day moving average and Awesome above zero. Buying on a rejection from 2,712, if the downside breakout fails, aims first to 2,727 and then to 2,748.
For sell positions, a confirmed breakdown of 2,712 opens a short position targeting 2,682, provided the moving average is above price and Awesome is below zero. A rejection from 2,727, if the upside breakout fails, gives a short for a return to 2,712 and then to 2,682. Both indicators remain filters to weed out false moves, not standalone reasons to enter early, and decisions are made only after actual price confirmation of the specified levels.
¡Los informes analíticos de InstaForex lo mantendrá bien informado de las tendencias del mercado! Al ser un cliente de InstaForex, se le proporciona una gran cantidad de servicios gratuitos para una operación eficiente.


