Analysis GBP/USD 5M
The GBP/USD pair traded very quietly on Thursday despite at least three noteworthy reports in the UK and the US. Reports are not driving the market right now — expectations are. Traders continue to expect the most hawkish actions possible from the Federal Reserve, which keeps dollar demand high. The Bank of England's policy stance therefore has little immediate impact. Rising inflation in the euro area and the UK does not change this. In short, the market either ignores pound-positive factors or looks past them. This morning both Fed chair Kevin Warsh and BoE governor Andrew Bailey are due to speak. Bailey's stance is clear: the BoE has not yet begun tightening, while UK inflation could reach 4% this year, in his view. As for Kevin Warsh, yesterday's US inflation report could stiffen his hawkish tone, but that is not certain. Many FOMC members expect inflation to slow next year as transitory factors fade, and if that proves correct, the Fed would have little reason to raise the policy rate more than about twice.
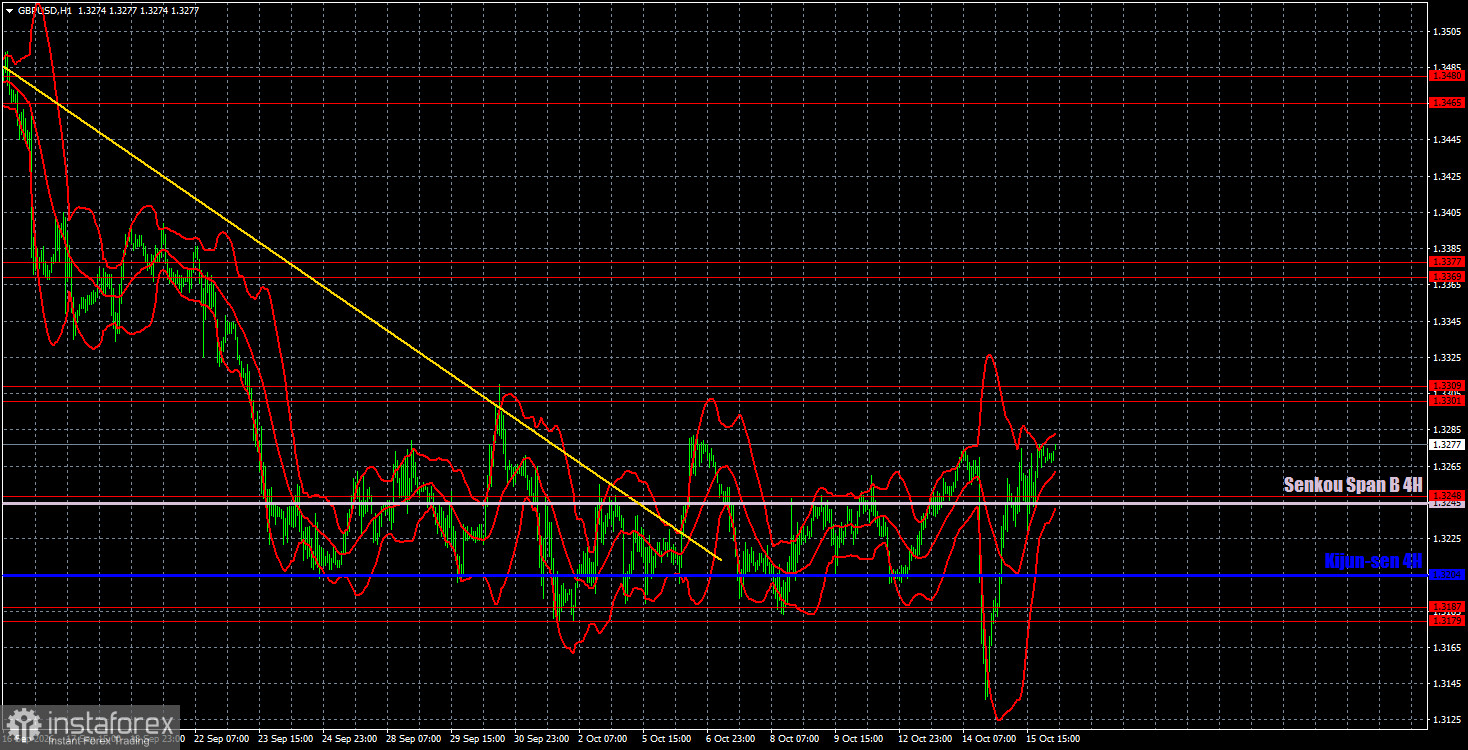
Technically, the pound has continued to form a downward trend, but it is likely complete. Sterling has returned to the sideways channel it has traded in for three weeks. Essentially, we saw liquidity taken from the lower boundary, supporting the view that a move up to the 1.3301–1.3309 area is plausible.
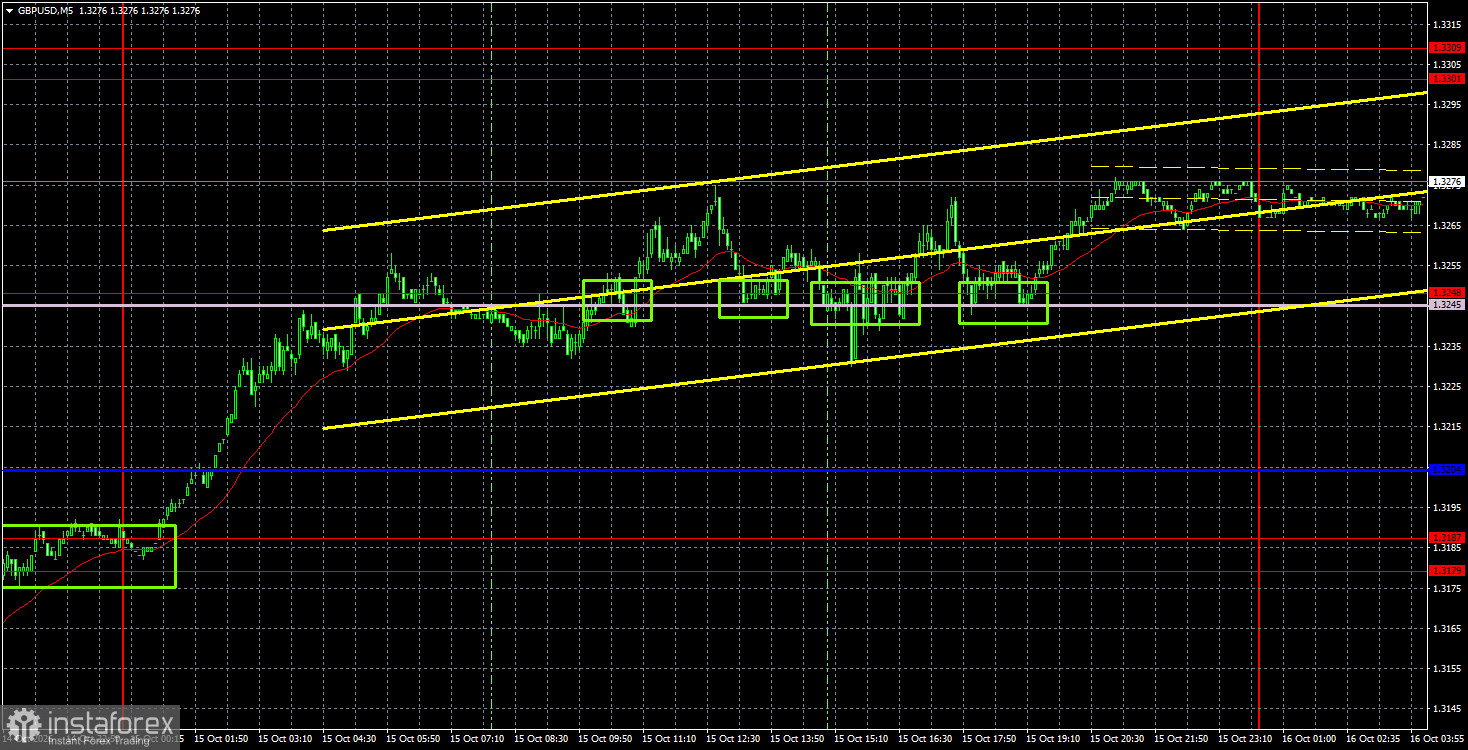
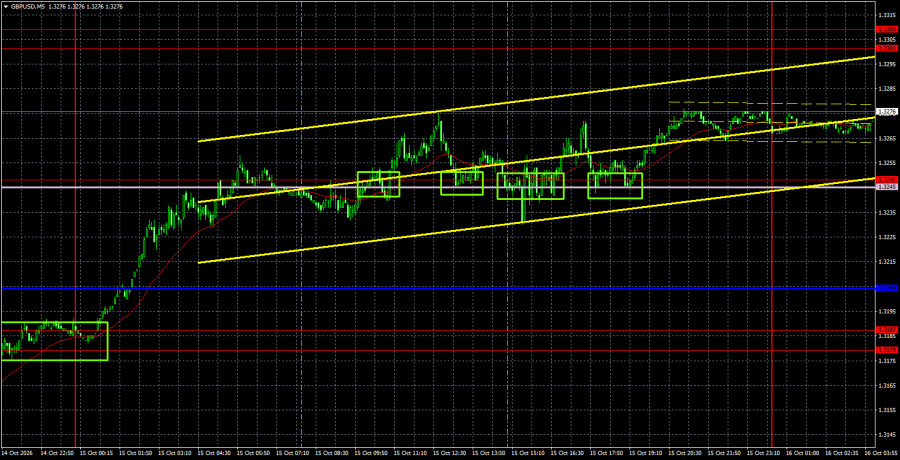
On the 5-minute chart, four buy signals formed in the 1.3245–1.3248 area on Thursday. Traders could have opened long positions that may develop further today.
COT Report
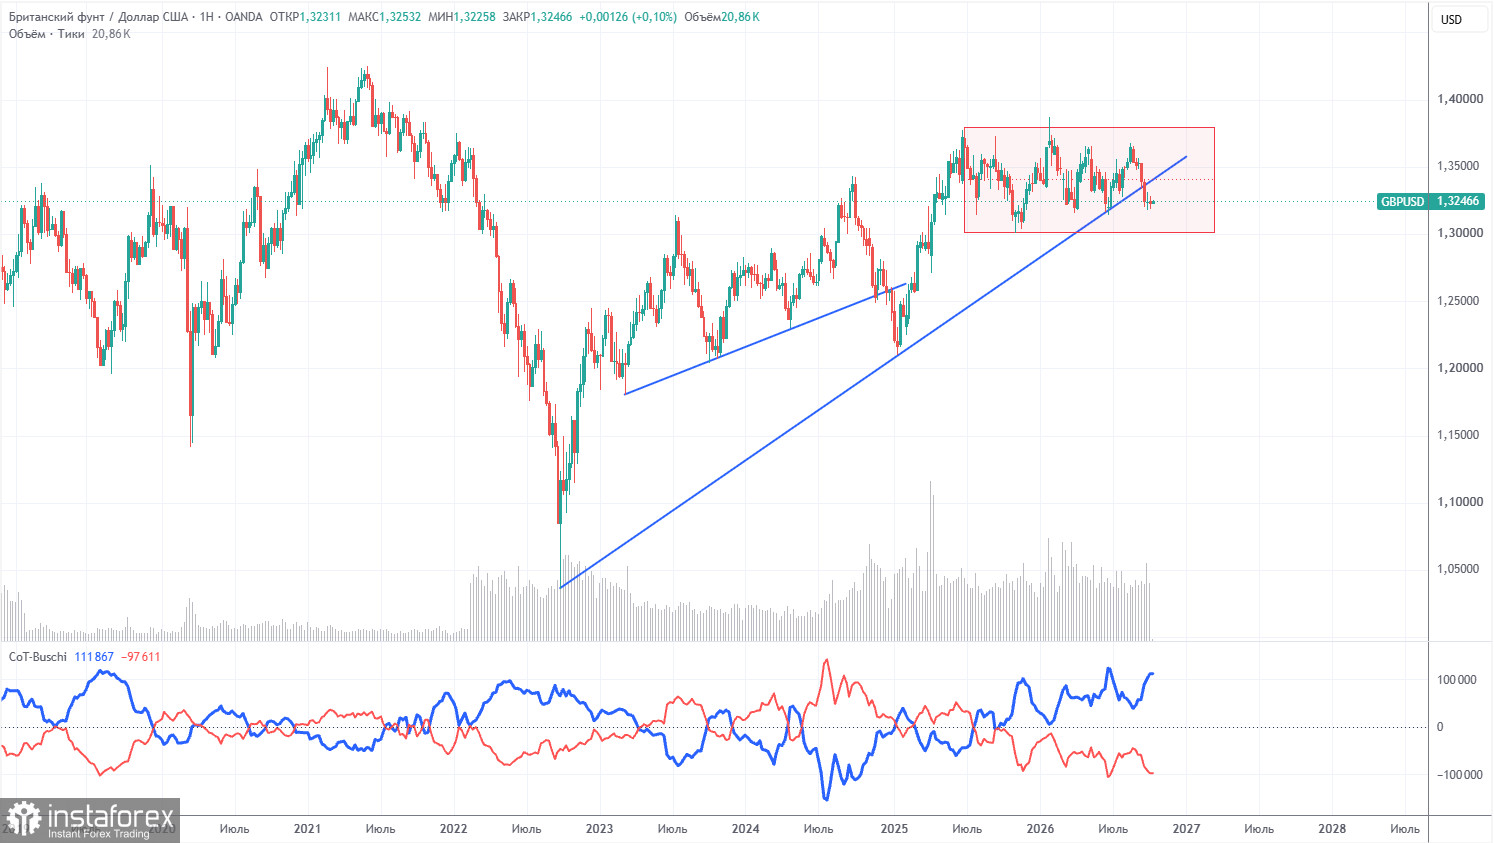
COT reports for the pound show that non-commercial traders have dominated on the sell side for several months. The net position is negative, despite the preservation of the long-term uptrend. Given events in the Middle East, it is unsurprising that demand for the dollar remains fairly high in 2026. The war between the US and Iran has been formally paused, but a new conflict has begun within Yemen. The Federal Reserve's shift in monetary policy stance also supports the dollar, and the uptrend line has been breached. However, it was breached within a flat, so we do not consider the uptrend finished.
In the long term, the dollar continues to decline due to Donald Trump's policies, which is clearly visible on the weekly timeframe. The trade war will continue in one form or another for a long time, and Trump's policies aim, directly and indirectly, to weaken the US currency. The long-term uptrend remains intact. According to the latest COT report (October 6), the "Non-commercial" group opened 3,800 BUY contracts and 10,400 SELL contracts. As a result, non-commercial traders' net position fell by 6,600 contracts over the week.
Analysis GBP/USD 1H
On the hourly timeframe, GBP/USD may be completing a downtrend that lasted a full month with no solid reason. On the daily and weekly timeframes, price cleared liquidity at previous lows and remained inside sideways channels. Thus, one can expect the pound to rise at least to 1.3650, the upper boundary of the daily-chart sideways channel. The pound's rise needs no more justification than the dollar's rise over the past month. Moves inside a flat rarely depend on fundamentals or macroeconomics.
For October 16 we highlight the following important levels: 1.3042–1.3050, 1.3096–1.3115, 1.3179–1.3187, 1.3248, 1.3301–1.3309, 1.3369–1.3377, 1.3465–1.3480, 1.3588, 1.3671–1.3681. Senkou Span B (1.3245) and Kijun-sen (1.3204) may also provide signals. It is recommended to move Stop Loss to breakeven once price has moved 20 pips in the correct direction. Ichimoku lines may shift during the day and should be considered when defining trading signals.
Today Andrew Bailey will speak in the UK and Kevin Warsh in the US. Their remarks will be accompanied by the US industrial-production report. The pound is likely to continue leaning toward recovery.
Summary of the above analysis:
Traders may consider the 1.3245–1.3248 area as a target for short positions if price rebounds from the 1.3301–1.3309 area. A close above 1.3301–1.3309 would allow the 1.3369–1.3377 area to be considered as targets for long positions.
Explanations for the illustrations:
- Price support and resistance levels (resistance/support) — thick red lines around which movement may end. They are not sources of trading signals.
- Kijun-sen and Senkou Span B lines — Ichimoku indicator lines transferred to the hourly timeframe from the 4-hour timeframe. They are strong lines.
- Extreme levels — thin red lines from which the price previously bounced. They are sources of trading signals.
- Yellow lines — trendlines, trend channels, and any other technical patterns.
- Indicator 1 on the COT charts — the size of the net position of each trader category.