Analysis of Tuesday's Trades:
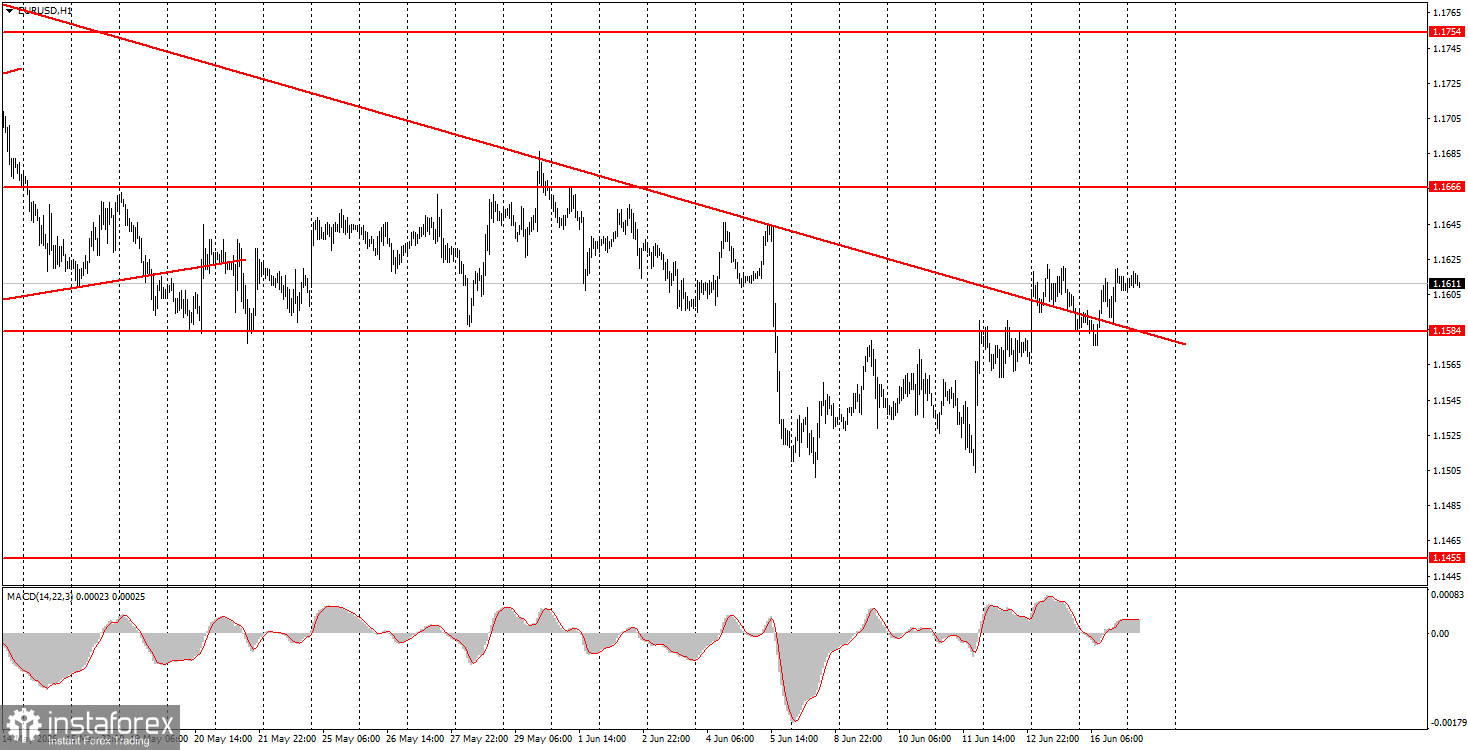
1H Chart of the EUR/USD Pair
The EUR/USD currency pair did not show any notable movement on Tuesday; however, it is worth noting that the price has barely breached the descending trend line. Thus, formally, the downward trend is over. We say "formally" because there will be a significant number of important events in the world today, tomorrow, and the day after that that will surely affect the pair's movement. Therefore, by the end of the week, the European currency could decline significantly, and the market is in no hurry to buy the pair amid the potential resolution of the conflict between Iran and the U.S. and the signing of a peace agreement. Yesterday, the ZEW Institute's economic expectations index was published in the European Union, and construction market data were released in the U.S. All these reports were ignored by traders, which is not surprising, as the market has been neglecting macroeconomic data for three months. Thus, further growth of the European currency is being hindered by the market's disbelief in a long-term peace in the Middle East and by the willingness of Iran and the U.S. to adhere to the conditions of the agreement reached.
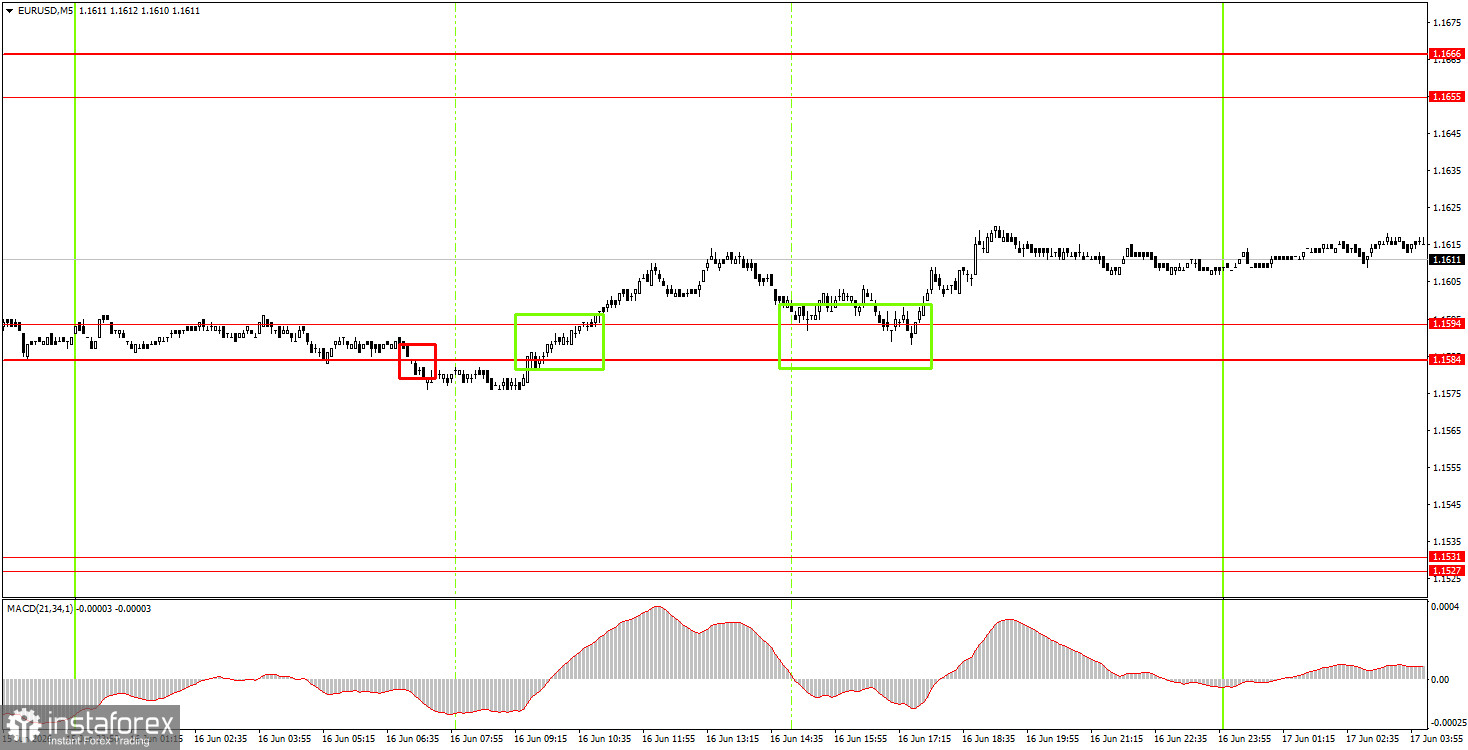
5M Chart of the EUR/USD Pair
On the 5-minute timeframe, three trading signals were generated on Tuesday. The first sell signal, in the form of the price closing below the 1.1584-1.1594 area, proved false, but the next two buy signals can be considered valid. Unfortunately, it was not possible to gain a good profit on the long positions due to weak volatility, but losses from the first trade could be mitigated. Trades could also be carried over to Wednesday.
How to Trade on Wednesday:
On the hourly timeframe, the downward trend has been broken, and the EUR/USD pair now has technical chances to form an upward trend. If full-scale war resumes in the Middle East, the dollar will rise again. If Tehran and Washington sign a deal, demand for risk-sensitive currencies will increase. However, at this time, the market remains skeptical about a future ceasefire between Iran and the U.S.
On Wednesday, novice traders may open short positions with a target of 1.1527-1.1531 if the price consolidates below the 1.1584-1.1594 area. Long positions remain relevant, with a target of 1.1655-1.1666, as the price has overcome the 1.1584-1.1594 area.
On the 5-minute timeframe, levels to consider are 1.1354-1.1363, 1.1413, 1.1455-1.1474, 1.1527-1.1531, 1.1584-1.1594, 1.1655-1.1666, 1.1745-1.1754, 1.1830-1.1837, 1.1899-1.1908. On Wednesday, European Central Bank President Christine Lagarde will speak in the European Union, and a retail sales report will be published in the U.S., along with the announcement of the Federal Reserve's meeting results. Of course, all market attention will be focused on the Fed.
Basic Rules of the Trading System:
- The strength of a signal is determined by the time it takes to form (a bounce or a breakout). The less time it took, the stronger the signal.
- If two or more trades were opened at a particular level on false signals, all subsequent signals from that level should be ignored.
- In a flat, any pair can form many false signals or none at all. Technical levels may be ignored.
- On the hourly timeframe, trading signals from the MACD indicator should be executed only when volatility is good, and a trend is confirmed by a trend line or channel.
- If two levels are too close together (5 to 20 pips), they should be considered a support or resistance area.
- After moving 15 pips in the correct direction, a Stop Loss should be placed at breakeven.
What's on the Charts:
Price levels (areas) of support and resistance are targets when opening long or short positions or sources of signals.
Red lines indicate channels or trend lines that display the current trend and indicate the preferred direction for trading.
The MACD indicator (14,22,3) – histogram and signal line – is a supplementary indicator that can also be used as a source of signals.
Important speeches and reports (contained in the news calendar) can significantly impact the movement of the currency pair. Therefore, during their release, trading should be conducted with maximum caution, or one should exit the market to avoid sharp reversals against preceding movements.
Beginners trading in the forex market should remember that not every trade can be profitable. Developing a clear strategy and practicing money management are key to long-term success in trading.