GBP/USD
Analysis:
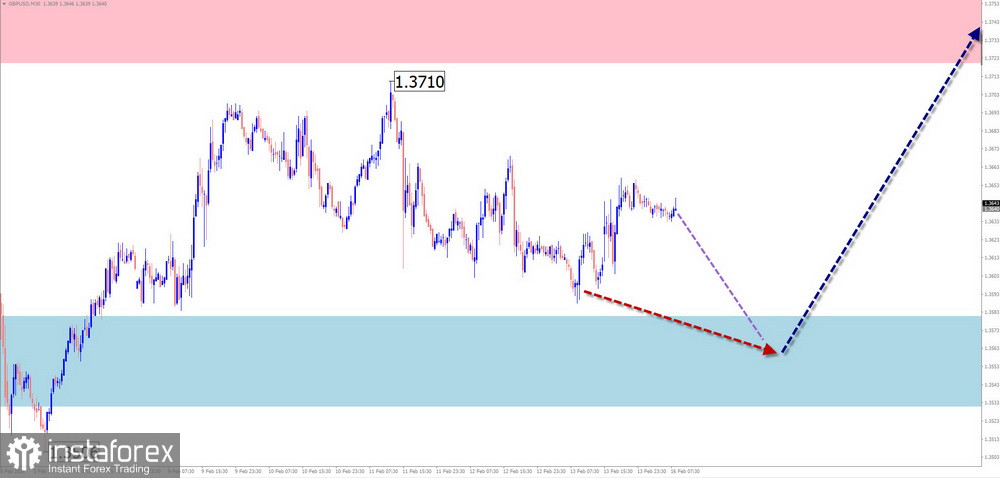
In recent years, price fluctuations of the British pound have been driven by a bullish trend algorithm. Since the end of January, the price has been forming a counter wave with potential that remains within the boundaries of a correction of the latest segment of the main trend. At the time of analysis, the wave structure is not yet complete. Quotes are located near the upper boundary of a strong weekly potential reversal zone.
Forecast:
At the beginning of the upcoming week, a generally sideways movement of the British currency is expected. A decline toward the support zone is possible. After that, a reversal and renewed price growth are anticipated. The resistance zone lies along the lower boundary of the preliminary target area.
Potential Reversal Zones
Resistance:
Support:
Recommendations:
Sell: Limited potential, high risk.
Buy: Will become relevant after confirmed reversal signals appear near the support zone.
AUD/USD
Analysis:
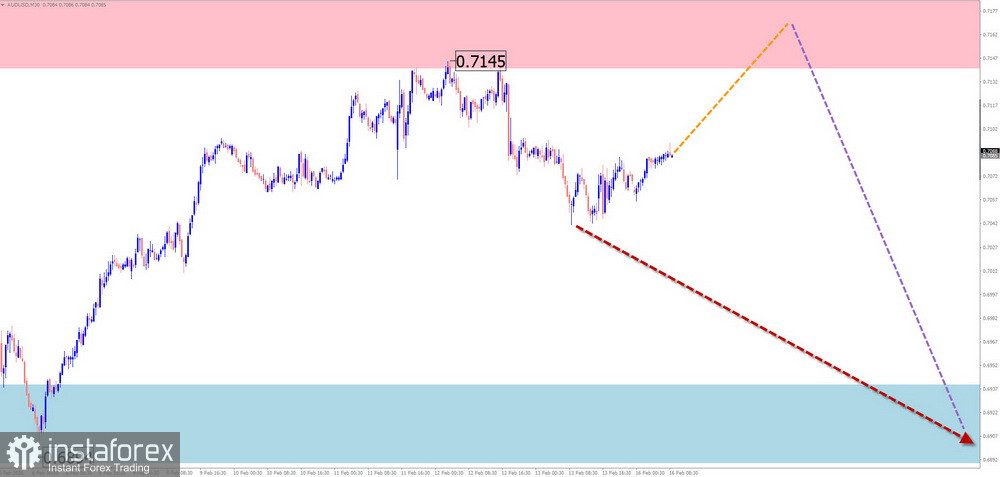
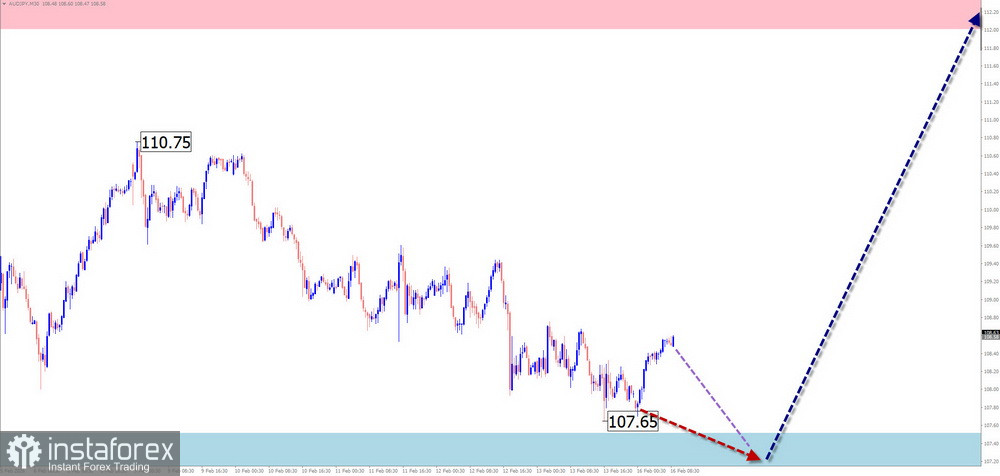
On the chart of the main Australian dollar pair, an upward wave structure has been developing since last spring. Since January 29, quotes have been forming a corrective wave in the shape of a running flat. The final segment (C) is still missing in this structure. The price has reached the lower boundary of a large-timeframe potential reversal zone.
Forecast:
Over the next couple of days, continued sideways movement with an upward bias is expected. Pressure on the resistance zone is possible, including a brief breakout above its upper boundary. Closer to the weekend, the probability of a change in direction and the start of a price decline increases.
Potential Reversal Zones
Resistance:
Support:
Recommendations:
Buy: Risky due to limited potential and may lead to losses.
Sell: Can be used within individual trading sessions with reduced position size after appropriate signals from your trading system appear.
USD/CHF
Analysis:
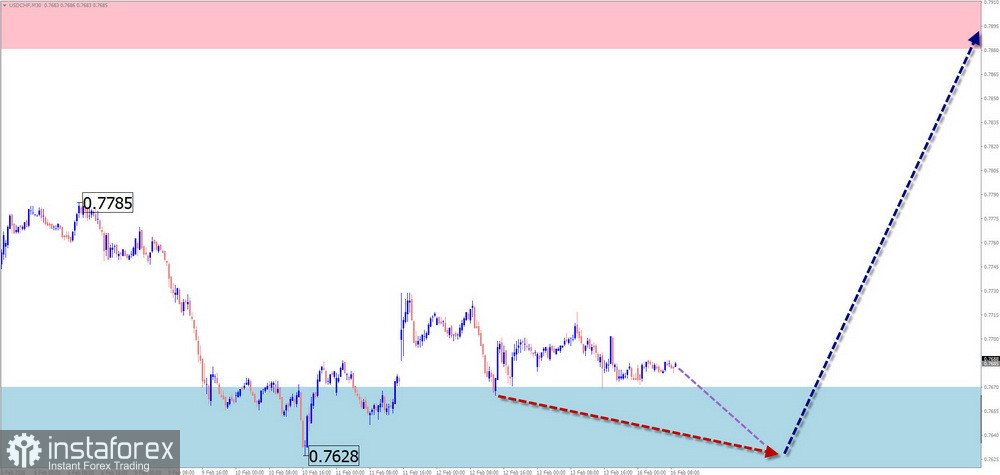
Since April of last year, price movement in the main Swiss franc pair has been driven by an upward wave. The structure of this wave model is formed as a running flat. Since January 27, an upward segment with reversal potential has been developing on the chart, which will initiate the final segment (C).
Forecast:
During the upcoming week, continued overall sideways price movement is expected. In the coming days, pressure on the lower boundary of the support zone is possible. A reversal and renewed growth of the pair can be expected toward the end of the week.
Potential Reversal Zones
Resistance:
Support:
Recommendations:
Sell: No potential.
Buy: Will become possible after confirmed reversal signals appear near the support zone.
EUR/JPY
Analysis:
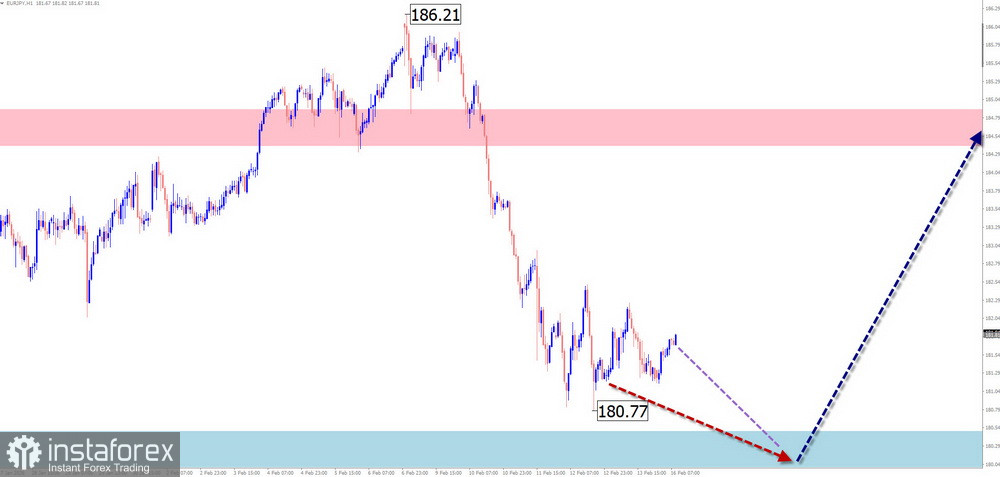
The unfinished upward wave model on the euro/yen cross chart has been developing since the end of February last year. Since autumn, quotes have been forming a running flat (B). The final segment is currently forming within the wave structure. The calculated support runs along the upper boundary of a weekly potential reversal zone.
Forecast:
Over the next few days, continued general downward movement is expected. After contacting the support zone, a sideways drift is likely. A brief breakout below the lower boundary of the zone is possible. Closer to the weekend, the probability of a change in direction and upward price growth toward the resistance zone increases.
Potential Reversal Zones
Resistance:
Support:
Recommendations:
Sell: Possible with partial position size within intraday trading.
Buy: Opportunity will arise after confirmed reversal signals appear near the support zone.
AUD/JPY
Brief Analysis:
Since last spring, the trend direction of the Australian dollar/Japanese yen pair has been set by a bullish wave. Since mid-January, a downward segment has been forming on the chart, which remains within the corrective boundaries of the latest trend segment. Its structure appears complete at the time of analysis, but no signals of an imminent reversal have yet formed on the chart.
Weekly Forecast:
In the coming days, the current decline is expected to fully complete. After that, a reversal may form in the support zone. A resumption of the pair's upward movement can be expected at the end of the current or the beginning of the next week.
Potential Reversal Zones
Resistance:
Support:
Recommendations
Sell: Limited potential and may result in losses.
Buy: Can be used in trading after reversal signals appear in the control zone.
EUR/GBP
Brief Analysis:
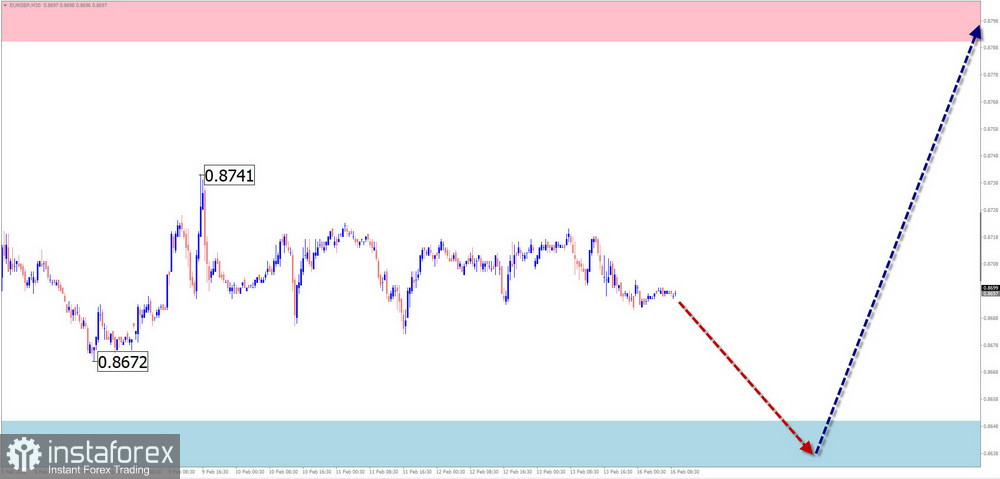
Since last April, price movement in the euro/British pound cross has been driven by an unfinished downward wave. The structure shows the formation of a running flat. The final segment (C) is still missing. Since the end of October last year, the price has been drifting sideways, forming a downward wave zigzag.
Weekly Forecast:
In the first half of the upcoming week, continued sideways movement with a downward bias toward the calculated support is likely. With high probability, this will be followed by a change in direction and growth of the cross rate. A rise toward the calculated resistance boundaries is expected.
Potential Reversal Zones
Resistance:
Support:
Recommendations
Buy: Conditions for such trades will appear after reversal signals form near the support zone.
Sell: Limited potential and may result in losses.
Notes: In simplified wave analysis (SWA), all waves consist of three parts (A–B–C). On each timeframe, the last unfinished wave is analyzed. Dashed lines indicate expected movements.
Attention: The wave algorithm does not take into account the duration of price movements over time.