Trade Analysis for Friday:
1H Chart of the EUR/USD Pair
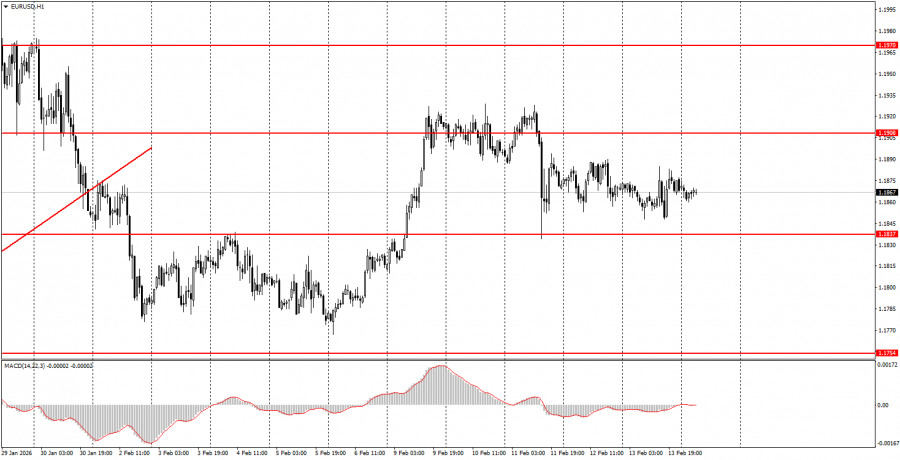
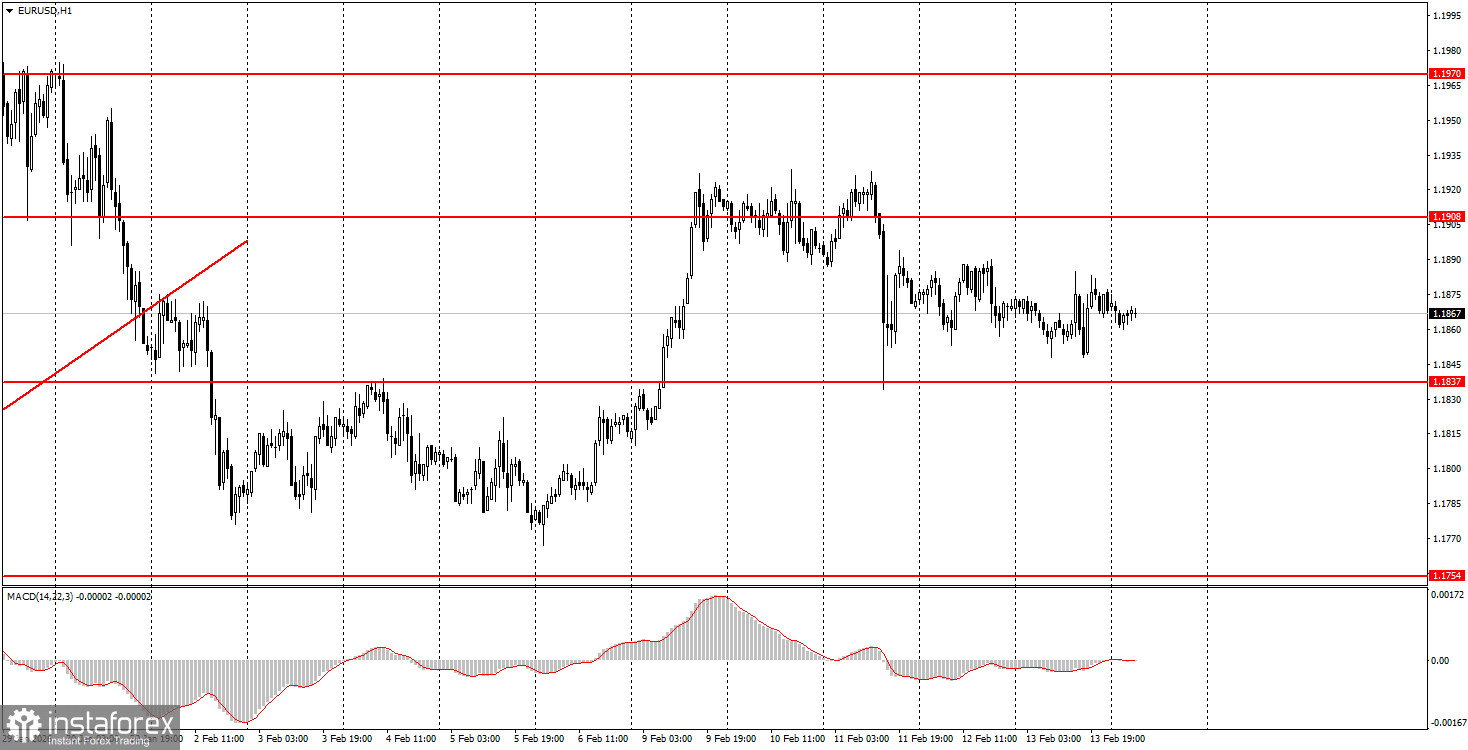
The EUR/USD currency pair traded exclusively sideways on Friday, with minimal volatility. It is worth noting that on Wednesday in the U.S., important reports on the labor market and unemployment were published. It cannot be said that the market completely ignored them, but the market's reaction was strange and ambiguous, just as the reports themselves. While the January unemployment rate and Non-Farm Payrolls figures were quite positive, the 2025 annual figure was revised down by 400,000. In our view, the annual figure in the Non-Farm Payrolls report is more important than the monthly one, so the dollar should have declined. Regarding Friday, the U.S. inflation report was published that day and showed a rather significant figure. Inflation slowed to 2.4%, suggesting expectations of a resumption of the Fed's monetary easing policy very shortly. For example, the Bank of England nearly cut rates at its last meeting with inflation at 3.4%, while the key rates of the BoE and the Federal Reserve are currently equal.
5M Chart of the EUR/USD Pair
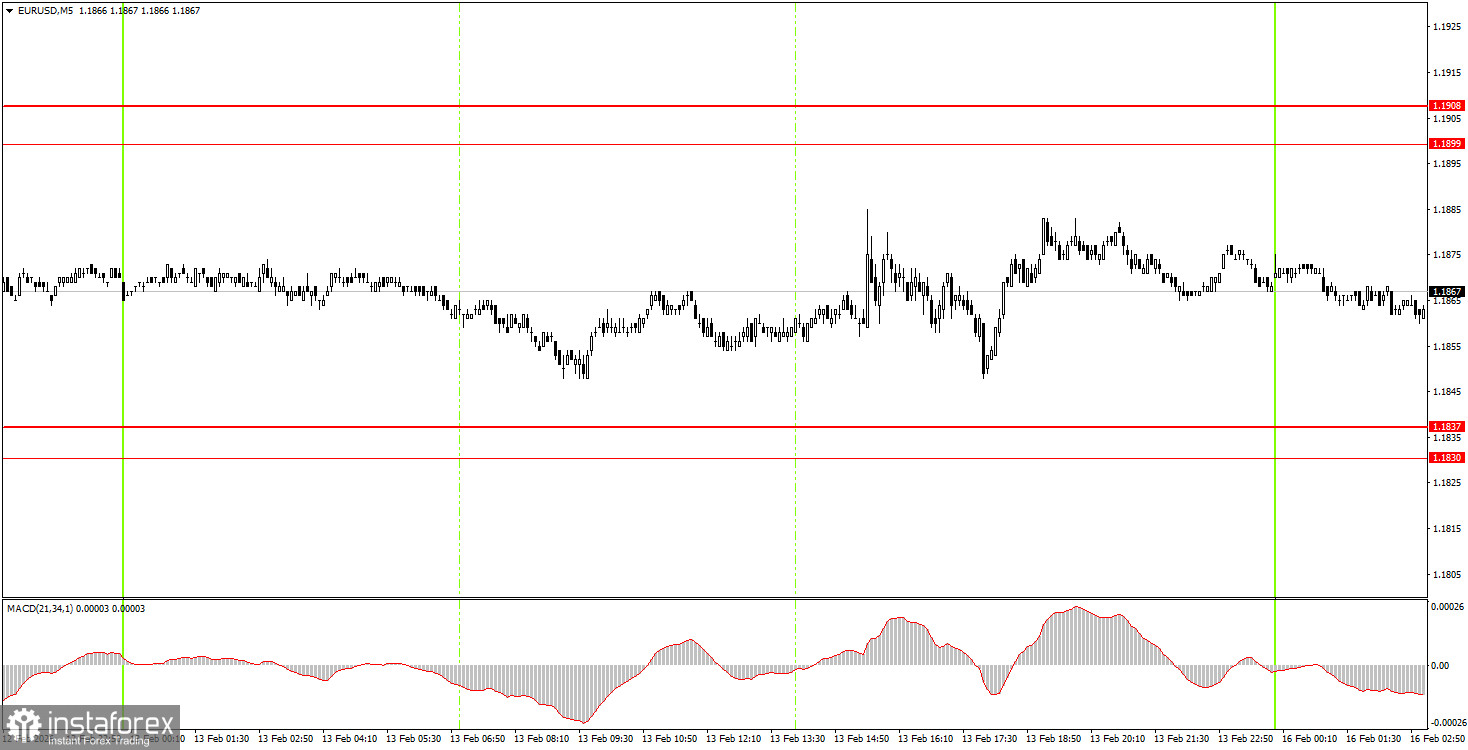
On the 5-minute timeframe on Friday, no trading signals were formed. Throughout the day, the pair only moved sideways and did not approach any levels. Thus, beginner traders had no basis for opening positions.
How to Trade on Monday:
The hourly timeframe shows a downward correction that may soon transform back into an upward one. It is worth reminding that the range, which lasted 7 months, is over. If this is the case, then a long-term upward trend has resumed at the beginning of 2026. Therefore, we are expecting a new medium-term decline in the dollar. The overall fundamental background remains very challenging for the American currency, so we fully support further movement to the upside.
On Monday, beginner traders may consider short positions if the price consolidates below the 1.1830-1.1837 range or if there is a bounce from the 1.1899-1.1908 area. Price consolidation above the area of 1.1899-1.1908 or a bounce from the area of 1.1830-1.1837 would allow for the opening of long positions with a target of 1.1970.
On the 5-minute timeframe, levels to consider include 1.1455-1.1474, 1.1527-1.1531, 1.1550, 1.1584-1.1591, 1.1655-1.1666, 1.1745-1.1754, 1.1830-1.1837, 1.1899-1.1908, 1.1970-1.1988, 1.2044-1.2056, 1.2092-1.2104. Today, the European Union will publish a December industrial production report, the only significant event of the day. Most likely, volatility will be low today, and the sideways movement will continue.
Main Rules of the Trading System:
- The strength of the signal is determined by the time it takes to form (rebound or breaking through the level). The shorter the time, the stronger the signal.
- If two or more trades were opened around a particular level based on false signals, all subsequent signals from that level should be ignored.
- In a flat market, any pair can generate numerous false signals or no signals at all. In any case, it is best to stop trading at the first signs of a flat.
- Trades are opened during the time period between the start of the European session and until the middle of the American session, after which all trades should be manually closed.
- On the hourly timeframe, signals from the MACD indicator should ideally be traded only when there is good volatility and a trend confirmed by a trend line or channel.
- If two levels are too close to each other (ranging from 5 to 20 pips), they should be considered as a support or resistance area.
- After moving 15 pips in the correct direction, it is advisable to set the Stop Loss to break-even.
What's on the Charts:
- Support and resistance levels are targets for opening buy or sell trades. Take Profit levels can be placed around them.
- Red lines indicate channels or trend lines that reflect the current trend and indicate the preferred direction for trading now.
- The MACD indicator (14,22,3) – the histogram and signal line – serves as a supplementary indicator that can also be used as a source of signals.
- Important speeches and reports (always found in the news calendar) can significantly influence the movement of the currency pair. Therefore, during their release, trading should be conducted with maximum caution, or it is advised to exit the market to avoid a sharp price reversal against the preceding movement.
- Beginners trading in the Forex market should remember that not every trade can be profitable. Developing a clear strategy and practicing sound money management are the keys to long-term trading success.