The cryptocurrency market has lost a staggering $2 trillion in market capitalization over the past few months. This is all you need to know about the stability of cryptocurrencies, their appeal as payment methods, and their use as a store of value. Recall that Bitcoin has always been known not only for its hyper-volatility but also for the lack of clear and understandable reasons for its price movements. For example, last year, Bitcoin plummeted into the abyss when Trump began imposing trade tariffs, and in the second half of the year, it rose on the same trade-war factor. "Experts" use all their literary talents to justify price movements. Many of them could write fantastic novels.
For instance, not long ago, there was a common belief that the Federal Reserve would continue to ease monetary policy and even increase quantitative easing, which would trigger a new rise for the first cryptocurrency. There was previously an opinion that Bitcoin serves as a hedge against inflation. High-correlation charts of the S&P 500 and gold were presented. As we can see, all these "justifications" are worth nothing. Many experts, first of all, are personally interested in Bitcoin's perpetual rise (because they hold crypto investments). Secondly, they select a suitable event to explain why Bitcoin is rising or will necessarily rise in the near future. Let's say, if you weren't trying to preserve capital from inflation through Bitcoin, you would be much wealthier.
Yesterday, Bitcoin was sold off by all major players. Major investment funds, Donald Trump's fund, Trump's son Barron Trump, everyone. The market began to experience "dumping"—the reverse phenomenon of "pumping." It is much easier to explain all Bitcoin movements using these two phenomena than by combining all fundamental factors. As we can see, the loyalty of the new U.S. administration and even the potential acceptance of the Clarity Act hold no significance for traders. Therefore, one should always strictly adhere to technical analysis. For crypto assets, it is more important than for currency or stock assets.
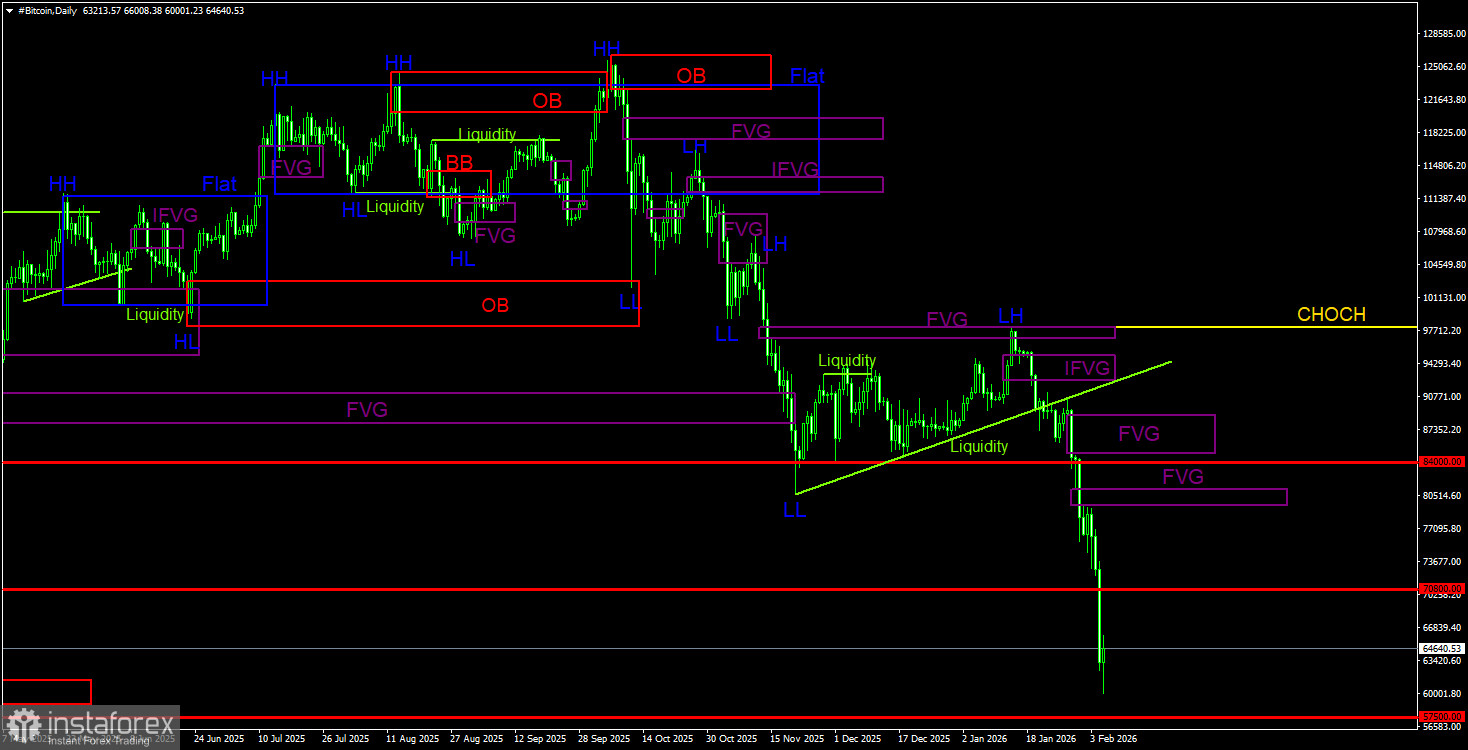
Trading Recommendations for BTC/USD:
On the daily timeframe, Bitcoin continues to form a downward trend. The trend is identified as descending, and the CHOCH line is currently at $97,900. Only above this level can it be considered that the downward trend is completed. "In 2026, Bitcoin could fall to $60,000." We said this earlier, and now Bitcoin is very close to $60,000. Just yesterday, BTC lost $10,000 in value. The price received a notable reaction to the "bearish" FVG ($96,900 – $98,000), and a trading signal was formed. Since then, Bitcoin has already lost $30,000. The next target for the decline is the level of $57,500 – 61.8% Fibonacci retracement level. There are currently three POI areas, and new ones may form in the near future. But what is the point of them if Bitcoin is not correcting?
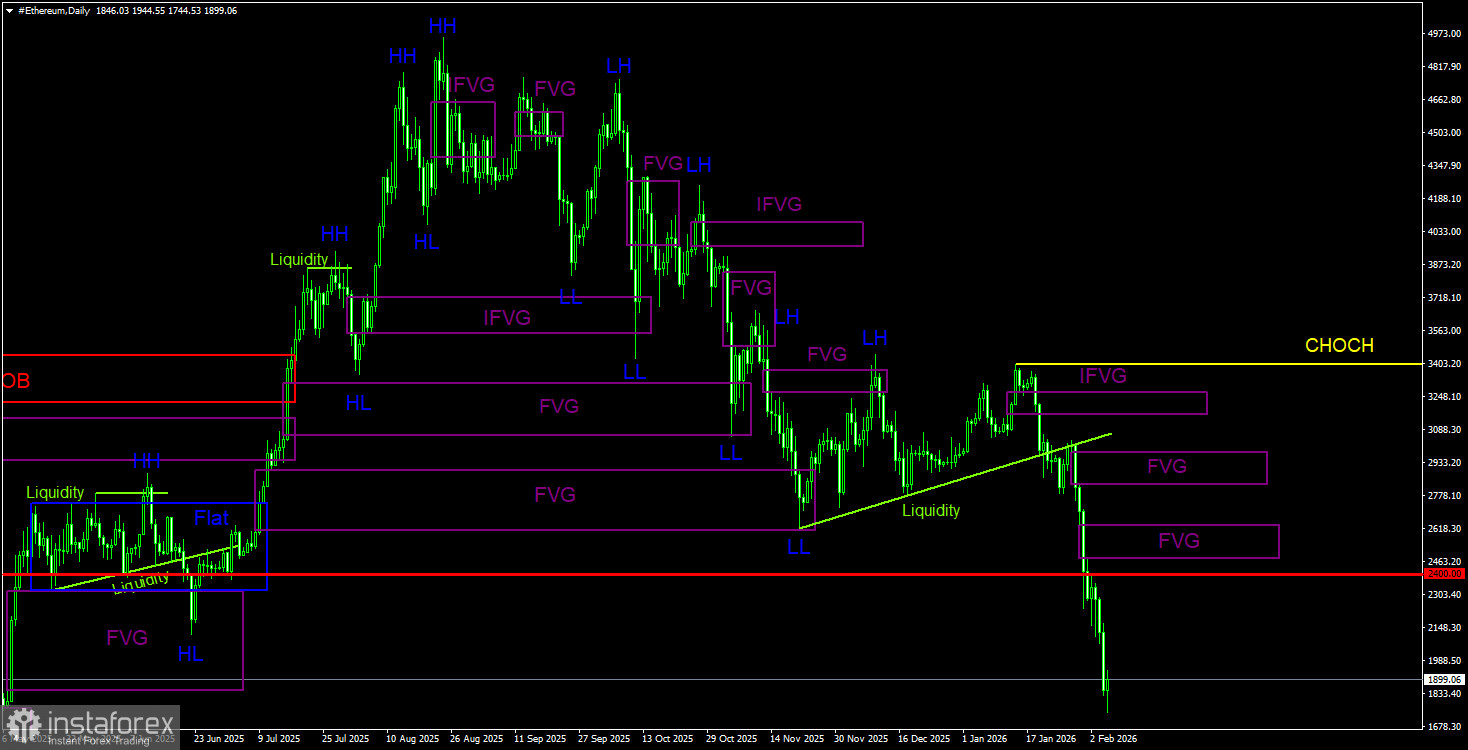
Trading Recommendations for ETH/USD:
On the daily timeframe for Ethereum, the crash also continues. We continue to observe the execution of a bearish order block on the weekly timeframe. We have emphasized multiple times that the downward movement could be strong and prolonged. This is indeed happening. On the daily timeframe for Ethereum, there are three bearish FVGs, and on the 4-hour timeframe, there are three bearish FVGs. Traders may look for opportunities to open new short positions from these patterns in the future. The targets for the decline in Ethereum extend to $1,370, the level where the last upward trend began. Currently, Ethereum is priced at $1,900... Last autumn, its cost was nearly $5,000.
Explanations for the Illustrations:
- CHOCH – Change of trend structure.
- Liquidity – Liquidity, Stop Loss orders of traders that market makers use to establish their positions.
- FVG – Fair Value Gap. The price passes through these areas very quickly, indicating a complete absence of one side in the market. Subsequently, the price tends to return and react from such areas.
- IFVG – Inverted Fair Value Gap. After a return to such an area, the price does not react to it; instead, it breaks through impulsively and then tests it from the other side.
- OB – Order Block. The candle on which the market maker opened a position to gather liquidity for forming their position in the opposite direction.