Analysis of Trades on Tuesday:
1-Hour Chart of the EUR/USD Pair
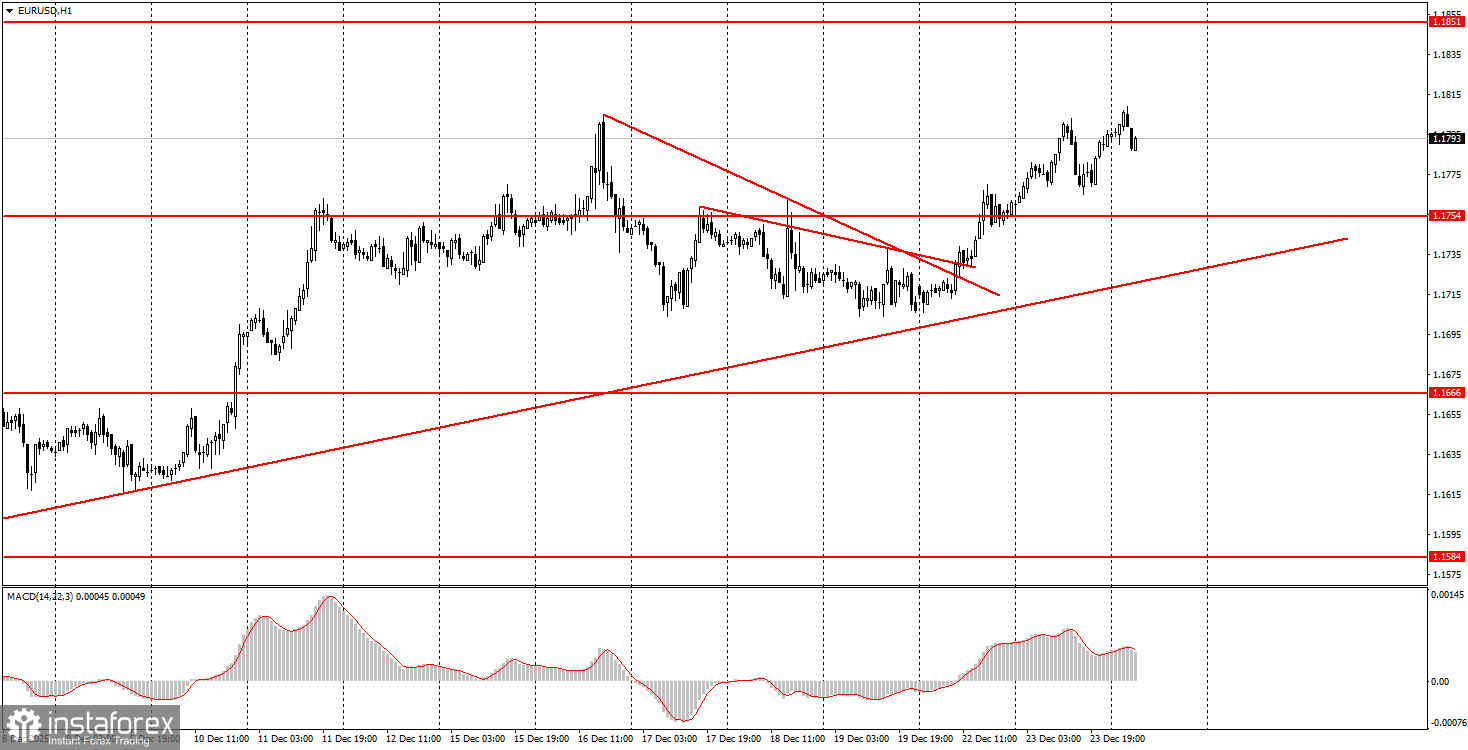
The EUR/USD currency pair continued its upward movement on Tuesday. This was the second consecutive day of growth, seemingly without sufficient grounds. However, it is essential to remember that we frequently discuss the factors supporting the pair's continued rise. Thus, even in the absence of local events and reports, the pair can still show growth, and this growth will be entirely logical and expected, as the trend on the daily timeframe remains upward. Unfortunately, the price has not yet managed to break out of the sideways channel on the same chart, so growth is restrained by the 1.1800-1.1830 area. However, there is an ascending trend line on the hourly timeframe, and until a consolidation below it occurs, it is unlikely to consider a new decline for the euro.
Yesterday, the US published its third-quarter GDP report, which significantly exceeded expectations and temporarily halted the US dollar's decline. However, as anticipated, it did not stop the decline but merely paused it. Two other reports on industrial production and durable goods orders again showed weak readings, so the dollar's rise was short-lived.
5-Minute Chart of the EUR/USD Pair
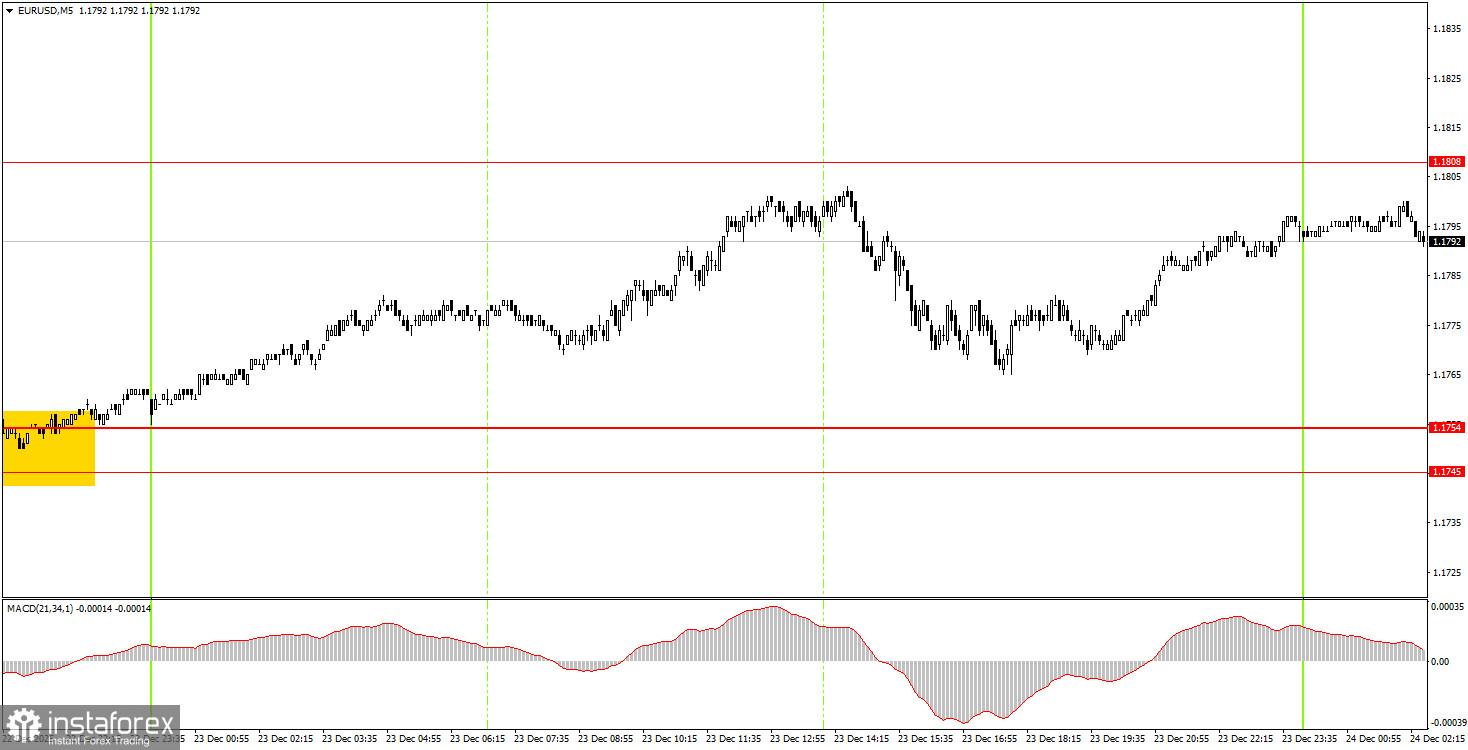
On the 5-minute timeframe, no trading signals were formed on Tuesday. The last buy signal was generated on Monday evening, and traders who acted on it could have made a good profit. The price settled above the 1.1745-1.1754 area, and today it may attempt to break above 1.1808.
How to Trade on Wednesday:
On the hourly timeframe, the EUR/USD pair continues to form an upward trend. The price may soon conduct a new test of the 1.1800-1.1830 area, which is the upper boundary of the flat on the daily timeframe. It is quite possible that this time a breakout will occur. The overall fundamental and macroeconomic backdrop for the US dollar remains very weak, so we expect the pair to rise in the medium term.
On Wednesday, novice traders may look to trade from the 1.1808 level, from which the price has already rebounded overnight. A bounce from this level could be viewed as a sell signal, but we are currently in an upward trend, even in the short term. A breakout above this level will signal a long position targeting 1.1851.
Key Levels to Consider on the 5-Minute Chart: 1.1354-1.1363, 1.1413, 1.1455-1.1474, 1.1527-1.1531, 1.1550, 1.1584-1.1591, 1.1655-1.1666, 1.1745-1.1754, 1.1808, 1.1851, 1.1908, 1.1970-1.1988. On Wednesday, there are no significant events or publications scheduled in the Eurozone or the US. However, the market shows its readiness to trade during the holidays, so it is not ruled out that growth will continue.
Key Rules of the Trading System:
- The strength of a signal is determined by the time it takes to form the signal (bounce or breakout). The less time required, the stronger the signal.
- If two or more trades were opened near any level based on false signals, all subsequent signals from that level should be ignored.
- In a flat, any pair may form numerous false signals or none at all. At the first signs of a flat, it is better to stop trading.
- Trades are opened during the period between the beginning of the European session and the middle of the American session, after which all trades should be closed manually.
- On the hourly timeframe, it is preferred to trade only when there is good volatility and a trend confirmed by the trend line or channel, using signals from the MACD indicator.
- If two levels are too close to each other (5 to 20 pips), they should be viewed as a support or resistance area.
- Upon moving 15 pips in the right direction, set the Stop Loss to breakeven.
Chart Explanations:
- Support and Resistance Levels: Levels that serve as targets for opening buys or sells. Take Profit levels can be placed near them.
- Red Lines: Channels or trend lines that reflect the current trend and indicate the preferred direction for trading.
- MACD Indicator (14, 22, 3): A histogram and signal line; a supplementary indicator that can also be used as a source of signals.
Important Note: Significant speeches and reports (always included in the news calendar) can greatly influence the movement of the currency pair. Therefore, during their release, it is advisable to trade cautiously or exit the market to avoid sharp reversals against the preceding movement.
Remember: For beginners trading in the Forex market, it is important to understand that not every trade can be profitable. Developing a clear strategy and practicing money management are keys to long-term trading success.