 Rimani
Condizioni di trading
Strumenti


The EUR/USD currency pair showed microscopic gains on Friday despite the strongest news from the Eurozone and the US. The euro once again failed to correct even slightly, and on Monday it plunged like a stone thrown off a cliff. That is actually a very mild description. The week had barely begun when the euro had already lost 60 pips over the weekend. Of course one can say that geopolitical tension in the Middle East rose again over the weekend — the Bab el-Mandeb strait was threatened as a full-scale war began between the Houthis and the internationally recognized Yemeni authorities. However, on Friday, the news flow favored the euro, yet it made no appreciable difference. Thus, the market continues to process incoming information selectively. Or it simply ignores it and buys the dollar. In any case, as we have been saying for two weeks, the current dollar rise cannot be called logical. That does not mean it should be ignored; on the contrary, the move is effectively one-sided, and what is better for traders than a one-sided move? One must understand that correlations between the news backdrop and market moves are virtually non-existent right now.
Technically, the downtrend continues to form. The market has been buying the dollar for the fourth week in a row. The trendline remains relevant; the price sits below the Ichimoku indicator lines, so technically the pair's decline is entirely logical.
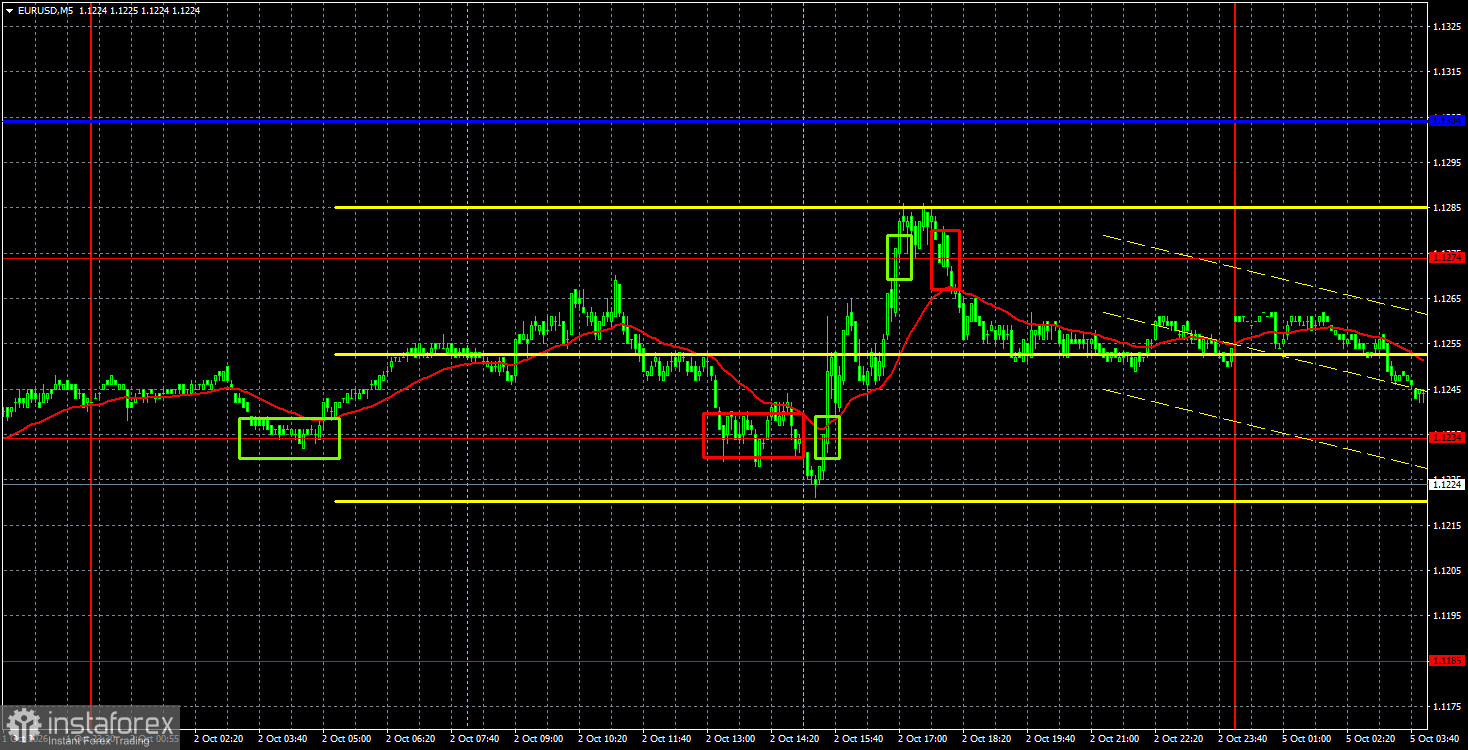
On the 5-minute TF, several trading signals formed on Friday, but the market is currently ignoring not only the macro and fundamental background but also technical levels. Signals were formed, but overall price ignored the levels and reversed wherever it chose.
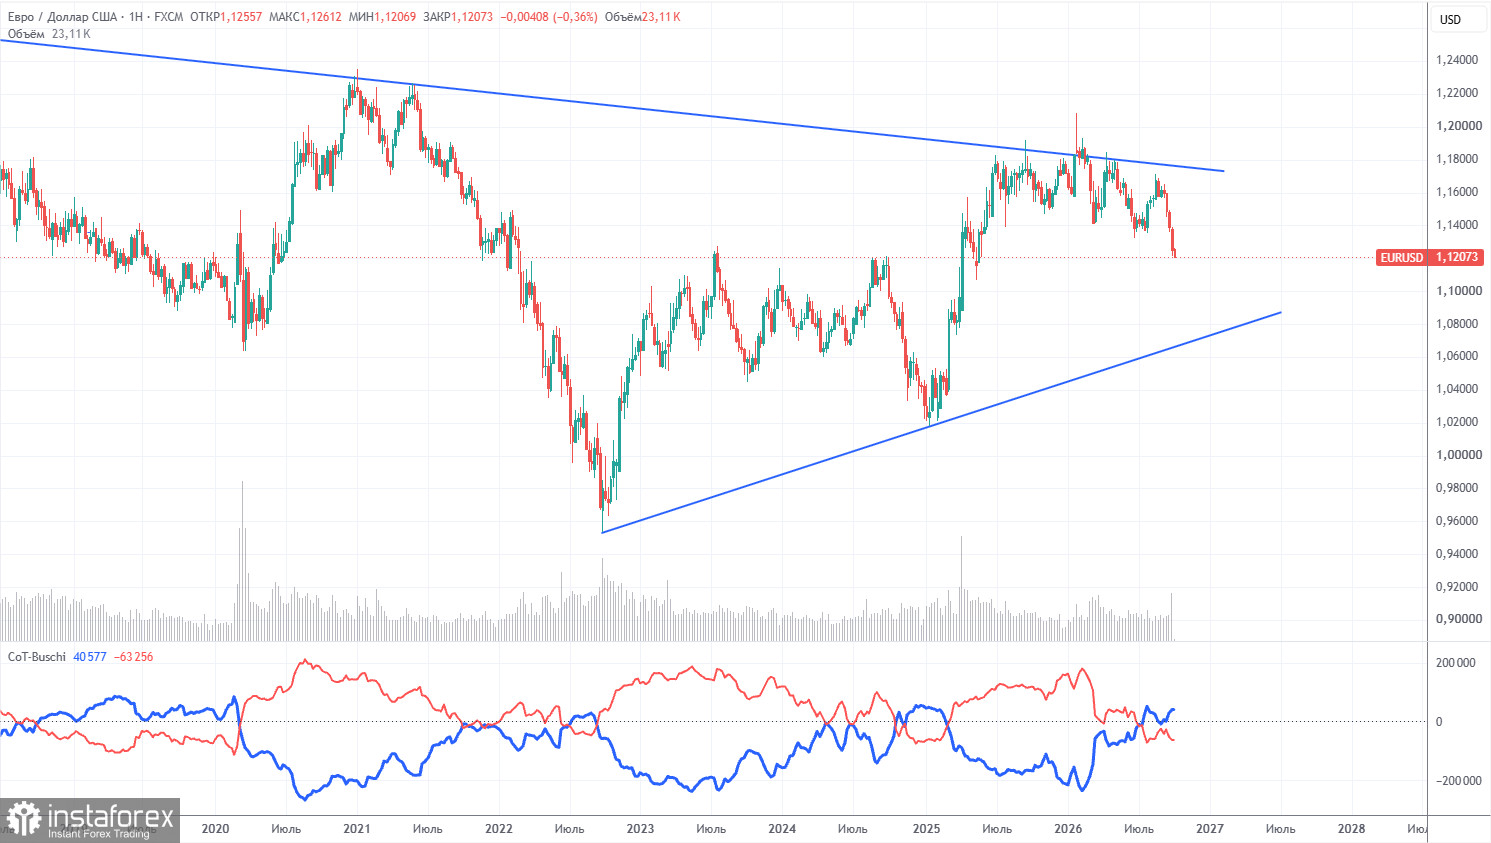
The latest COT report is dated September 29. On the weekly TF chart, non-commercial traders' net position remains "bearish" and fell significantly in 2026 due to geopolitical events. Traders have been shedding the euro in favor of the US dollar over the past six months. Donald Trump's policies have not changed, but the dollar has, for a time, acted as a "reserve currency."
However, we still do not see any fundamental factors for further strengthening of the US currency. The war in the Middle East made the dollar temporarily super-attractive, and the Federal Reserve's monetary stance surprised the dollar for the second time this year. In the long term, the euro could fall even to $1.08 (the trendline), but the uptrend will remain relevant. However, in recent weeks the market has accounted only for factors positive to the dollar and ignored all others.
The arrangement of the red and blue indicator lines points to an approximate parity between bulls and bears. During the last reporting week, longs in the "Non-commercial" group rose by 17,500, while short positions rose by 28,400. Accordingly, the net position for the week decreased by 10,900 contracts.
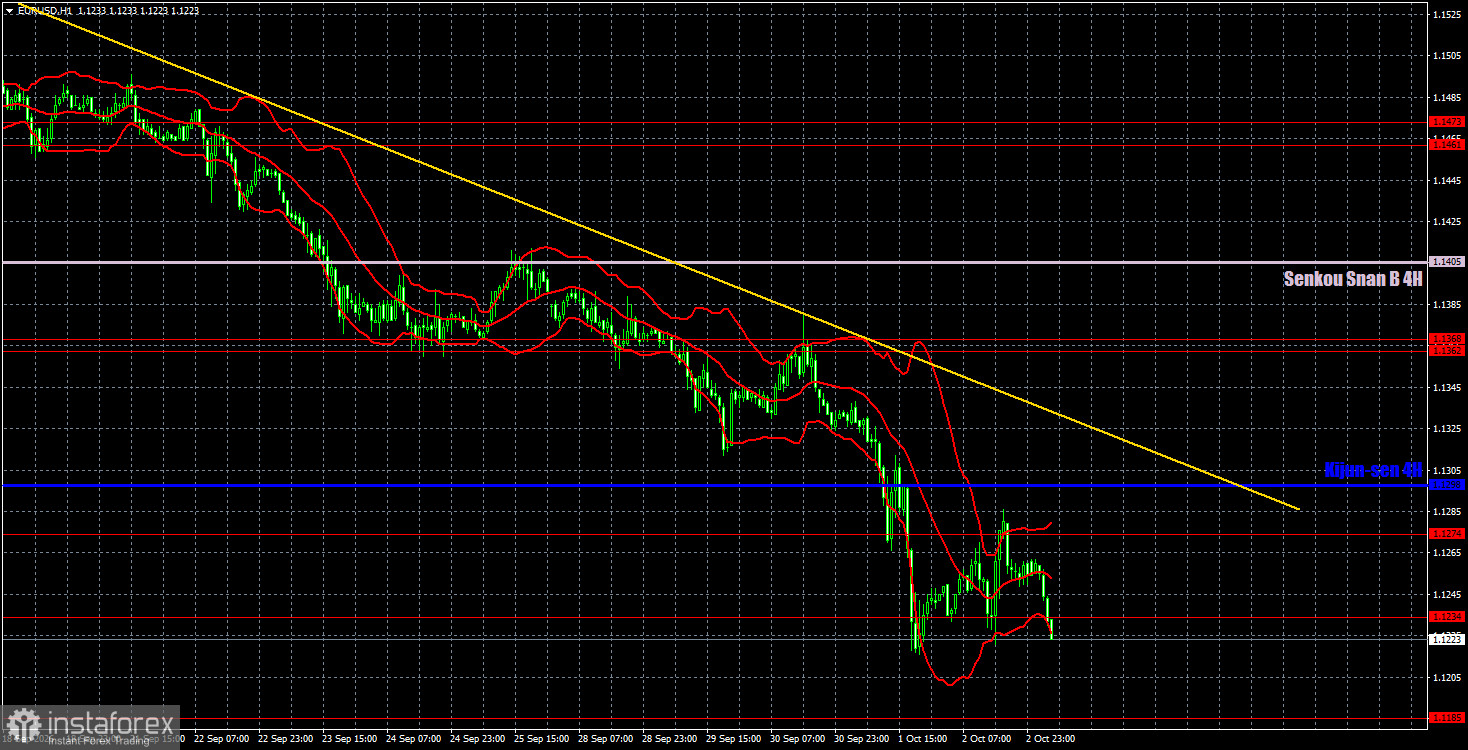
On the hourly timeframe, EUR/USD continues to form a downward trend, and the Fed helped drive the southbound move, though this factor is unlikely to be the reason for the dollar's rise at present. The European Central Bank should have supported the euro, having already raised rates twice in 2026, and Friday's US data should have triggered a dollar collapse. But the market now sees no factors supporting the euro. Thus, the dollar continues forming a strong trend that now depends only on market sentiment.
For October 5 we highlight the following levels for trading — 1.1092, 1.1147, 1.1185, 1.1234, 1.1274, 1.1362–1.1368, 1.1461–1.1473, 1.1536–1.1542, 1.1585, 1.1657–1.1665, as well as the Senkou Span B line (1.1405) and Kijun-sen (1.1298). The Ichimoku indicator lines may move during the day, so account for this when determining trading signals. Don't forget to move the Stop Loss to breakeven if the price moves 15 pips in the correct direction. This will protect against possible losses if the signal turns out to be false.
On Monday, no important events are scheduled in the Eurozone, while the US will release the ISM services activity index. However, the day began with a collapse of the euro, presumably on geopolitical grounds. Thus, the ISM index is unlikely to have much effect.
Traders can consider targets for shorts around 1.1147 and 1.1092 if the price consolidates below 1.1185. If the trendline is breached, consider targets for long positions: 1.1362–1.1368 and 1.1405.
Le recensioni analitiche di InstaForex ti renderanno pienamente consapevole delle tendenze del mercato! Essendo un cliente InstaForex, ti viene fornito un gran numero di servizi gratuiti per il trading efficiente.


