Analysis of Tuesday's Trades:
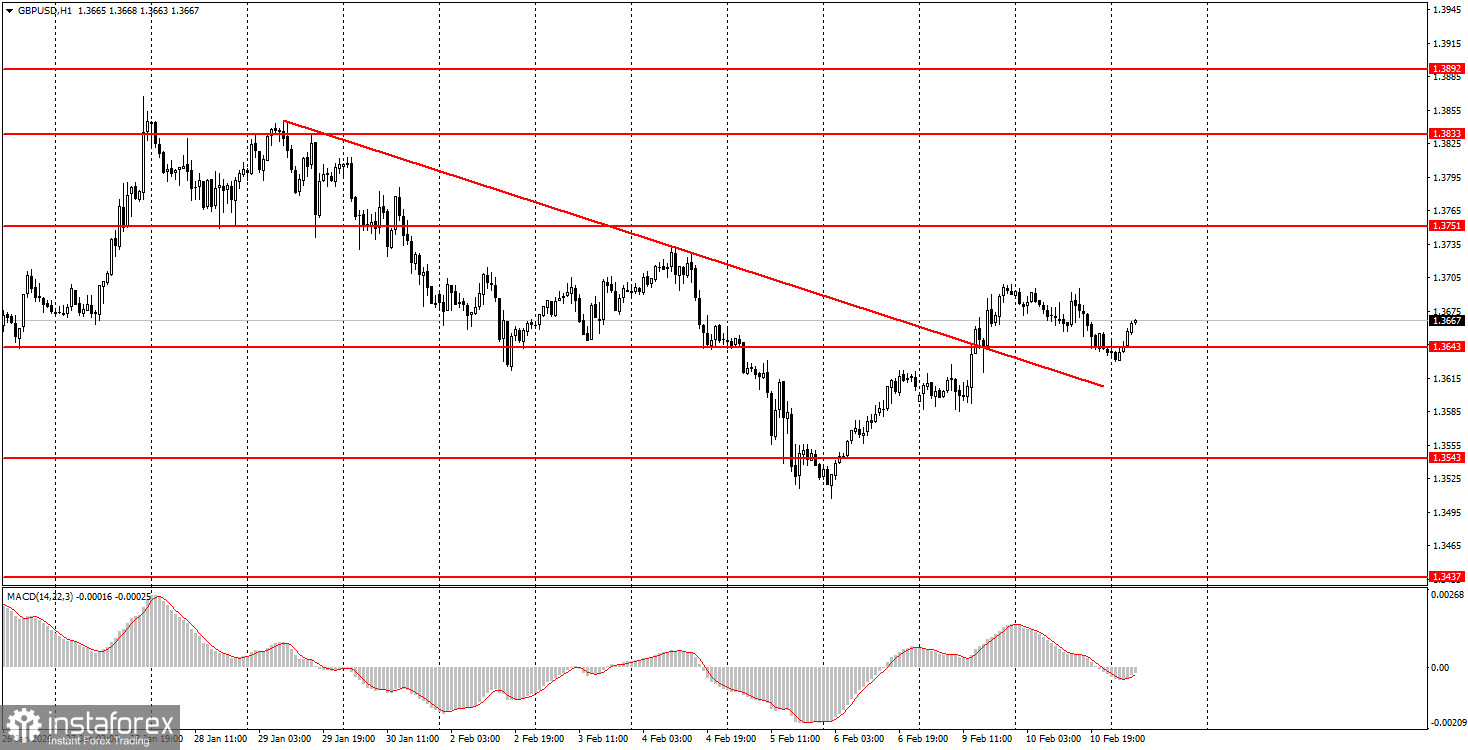
1H Chart of the GBP/USD Pair
The GBP/USD pair also traded with minimal volatility on Tuesday while maintaining an upward trend. Recall that on Monday, the descending trend line was broken, so the trend is now upward on the hourly timeframe. Yesterday, we observed a typical retracement. However, today may bring surprises. The market has already adjusted for weak US labor market and unemployment data, relying on speeches by some Federal Reserve officials and the ADP and JOLTs reports released last week, which showed disappointing figures. But it's important to note that the report values may be weak yet still better than forecasts. Conversely, strong report values could also lead to revisions (in either direction) for previous months. Therefore, it should not be assumed that the dollar will definitely fall this afternoon. Overall, the outlook for the American currency remains quite murky, but that does not mean the dollar will decline every day.
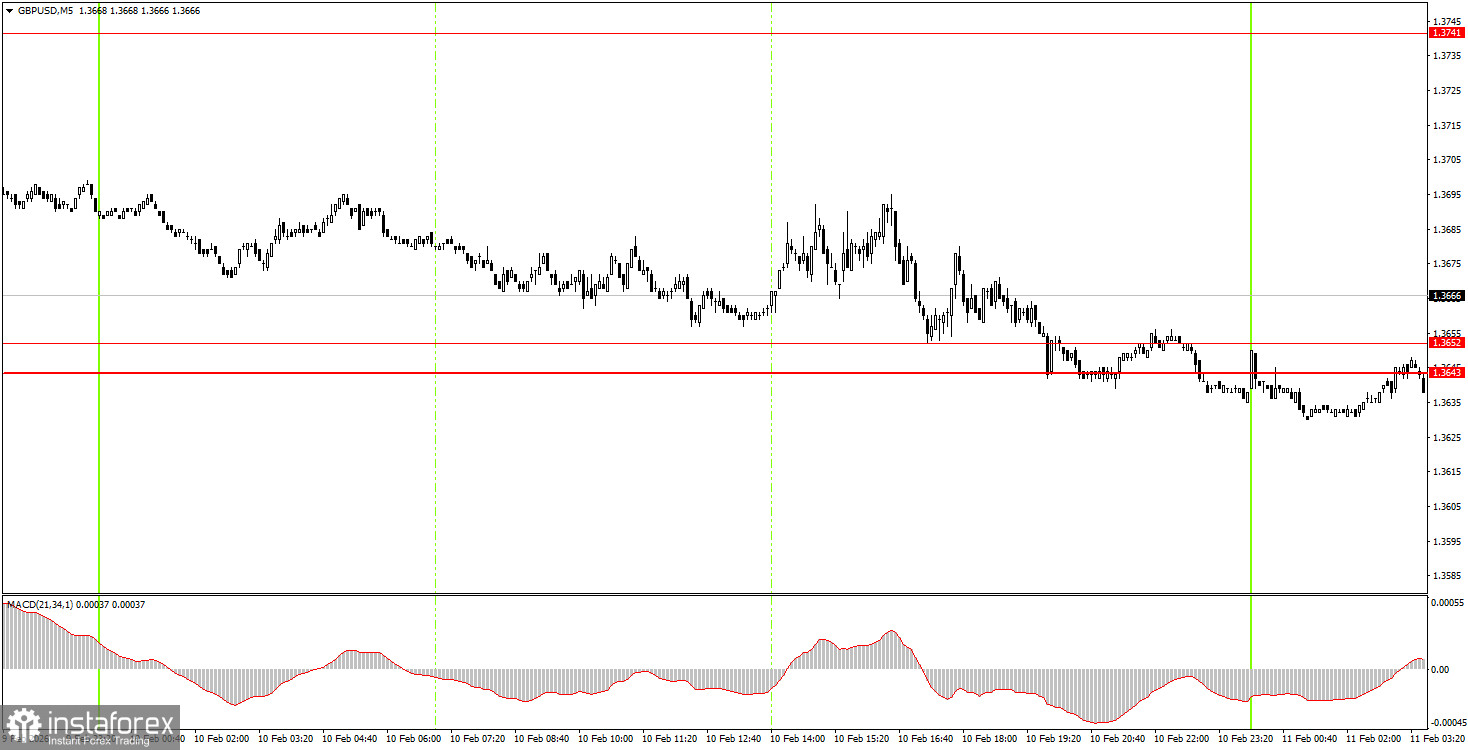
5M Chart of the GBP/USD Pair
On the 5-minute timeframe, no trading signals were formed on Tuesday. This may have been for the best, as the day's movements were not particularly good, chaotic, and close to flat. More active movements are expected today. The market may begin to price in macroeconomic data from across the ocean as early as the morning.
How to Trade on Wednesday:
On the hourly timeframe, the GBP/USD pair has broken the downward trend. There are no global grounds for medium-term dollar growth, so in 2026, we expect the global upward trend from 2025 to continue, which could push the pair to at least 1.4000. In recent weeks, the situation has not favored the British currency, but the pound now has every chance of returning to the 38 level.
On Wednesday, beginner traders may consider short positions if the pair consolidates below the 1.3643-1.3652 area, with a target of 1.3529-1.3543. A price consolidation above the 1.3643-1.3652 area allows opening long positions with a target of 1.3741-1.3751.
On the 5-minute timeframe, levels to consider include 1.3319-1.3331, 1.3365, 1.3403-1.3407, 1.3437-1.3446, 1.3484-1.3489, 1.3529-1.3543, 1.3643-1.3652, 1.3741-1.3751, 1.3814-1.3832, 1.3891-1.3912, and 1.3975. There are no interesting events or reports scheduled in the UK on Wednesday, but in the US, important reports on the labor market and unemployment will be published. Thus, in the second half of the day, the price may start to "fly," and beginner traders should not forget about the stop loss.
Main Rules of the Trading System:
- The strength of the signal is determined by the time it takes to form (rebound or breaking through the level). The shorter the time, the stronger the signal.
- If two or more trades were opened around a particular level based on false signals, all subsequent signals from that level should be ignored.
- In a flat market, any pair can generate numerous false signals or no signals at all. In any case, it is best to stop trading at the first signs of a flat.
- Trades are opened during the time period between the start of the European session and until the middle of the American session, after which all trades should be manually closed.
- On the hourly timeframe, signals from the MACD indicator should ideally be traded only when there is good volatility and a trend confirmed by a trend line or channel.
- If two levels are too close to each other (ranging from 5 to 20 pips), they should be considered as a support or resistance area.
- After moving 20 pips in the correct direction, it is advisable to set the Stop Loss to break-even.
What's on the Charts:
- Support and resistance levels are targets for opening buy or sell trades. Take Profit levels can be placed around them.
- Red lines indicate channels or trend lines that reflect the current trend and indicate the preferred direction for trading now.
- The MACD indicator (14,22,3) – the histogram and signal line – serves as a supplementary indicator that can also be used as a source of signals.
- Important speeches and reports (always found in the news calendar) can significantly influence the movement of the currency pair. Therefore, during their release, trading should be conducted with maximum caution, or it is advised to exit the market to avoid a sharp price reversal against the preceding movement.
- Beginners trading in the Forex market should remember that not every trade can be profitable. Developing a clear strategy and practicing sound money management are the keys to long-term trading success.