Analysis of Tuesday's Trades:
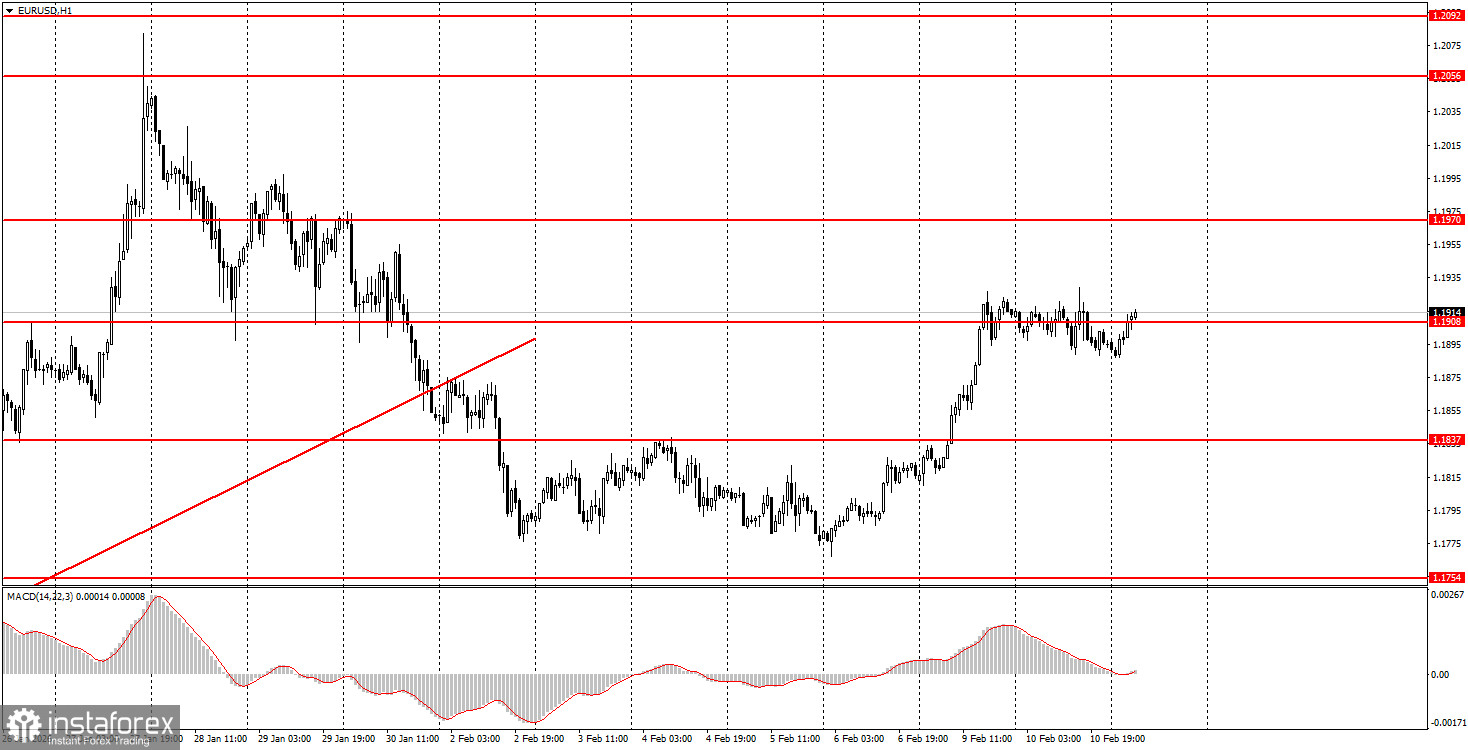
1H Chart of the EUR/USD Pair
The EUR/USD currency pair traded with minimal volatility, mostly sideways, on Tuesday. On Monday, we saw a strong increase in the pair following the Chinese government's ban on commercial banks from purchasing American Treasury bonds. Still, on Tuesday, the only interesting event was the US retail sales report. The report came in weak, showing zero growth in December, below expectations of +0.4%. However, the market was in a pause mode and paid no attention to this report. The pause was needed to prepare for today's events. Today, the Non-Farm Payroll and unemployment reports will be released in the US. A lot has been said about these reports, but they remain key for the US dollar because they directly affect the Fed's monetary policy. The US labor market remains in a dire state, reinforcing the likelihood that the Fed will return to monetary easing.
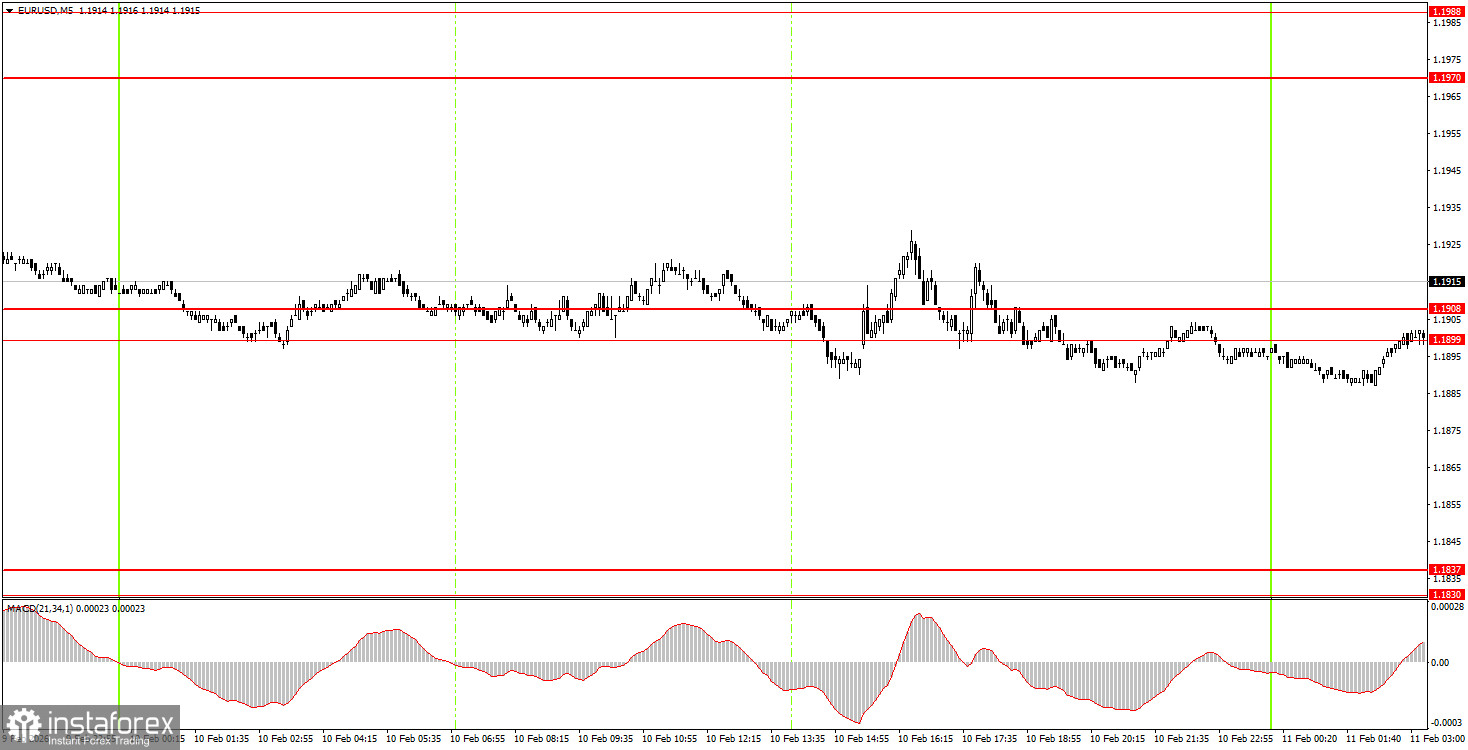
5M Chart of the EUR/USD Pair
On the 5-minute timeframe, the price ignored any levels and areas on Tuesday due to total flatness. Undoubtedly, beginner traders might have struggled to understand the situation and open trades. However, it became clear during the American trading session that there would be no movements, and the market was clearly waiting for data from across the ocean. It was not the best day for traders, but such days do happen.
How to Trade on Wednesday:
On the hourly timeframe, a downward correction is still in effect but could soon revert to an upward trend. Recall that the flat phase, which lasted 7 months, has ended. If this is the case, the long-term upward trend has resumed at the beginning of 2026. Thus, we expect a new medium-term decline in the dollar. The overall fundamental backdrop remains very challenging for the American currency, so we fully support further movement to the north.
On Wednesday, beginner traders may consider short positions if the price consolidates below the 1.1899-1.1908 area, with a target of 1.1830-1.1837. A price consolidation above the 1.1899-1.1908 area allows opening long positions with a target at 1.1970.
On the 5-minute timeframe, levels to consider include 1.1455-1.1474, 1.1527-1.1531, 1.1550, 1.1584-1.1591, 1.1655-1.1666, 1.1745-1.1754, 1.1830-1.1837, 1.1899-1.1908, 1.1970-1.1988, 1.2044-1.2056, and 1.2092-1.2104. Today, there are no significant events scheduled in the Eurozone, while in the US, the Non-Farm Payroll, unemployment rate, and wage data will be published. A storm could be expected at the beginning of the American trading session.
Main Rules of the Trading System:
- The strength of the signal is determined by the time it takes to form (rebound or breaking through the level). The shorter the time, the stronger the signal.
- If two or more trades were opened around a particular level based on false signals, all subsequent signals from that level should be ignored.
- In a flat market, any pair can generate numerous false signals or no signals at all. In any case, it is best to stop trading at the first signs of a flat.
- Trades are opened during the time period between the start of the European session and until the middle of the American session, after which all trades should be manually closed.
- On the hourly timeframe, signals from the MACD indicator should ideally be traded only when there is good volatility and a trend confirmed by a trend line or channel.
- If two levels are too close to each other (ranging from 5 to 20 pips), they should be considered as a support or resistance area.
- After moving 15 pips in the correct direction, it is advisable to set the Stop Loss to break-even.
What's on the Charts:
- Support and resistance levels are targets for opening buy or sell trades. Take Profit levels can be placed around them.
- Red lines indicate channels or trend lines that reflect the current trend and indicate the preferred direction for trading now.
- The MACD indicator (14,22,3) – the histogram and signal line – serves as a supplementary indicator that can also be used as a source of signals.
- Important speeches and reports (always found in the news calendar) can significantly influence the movement of the currency pair. Therefore, during their release, trading should be conducted with maximum caution, or it is advised to exit the market to avoid a sharp price reversal against the preceding movement.
- Beginners trading in the Forex market should remember that not every trade can be profitable. Developing a clear strategy and practicing sound money management are the keys to long-term trading success.