Wednesday's Trade Analysis:
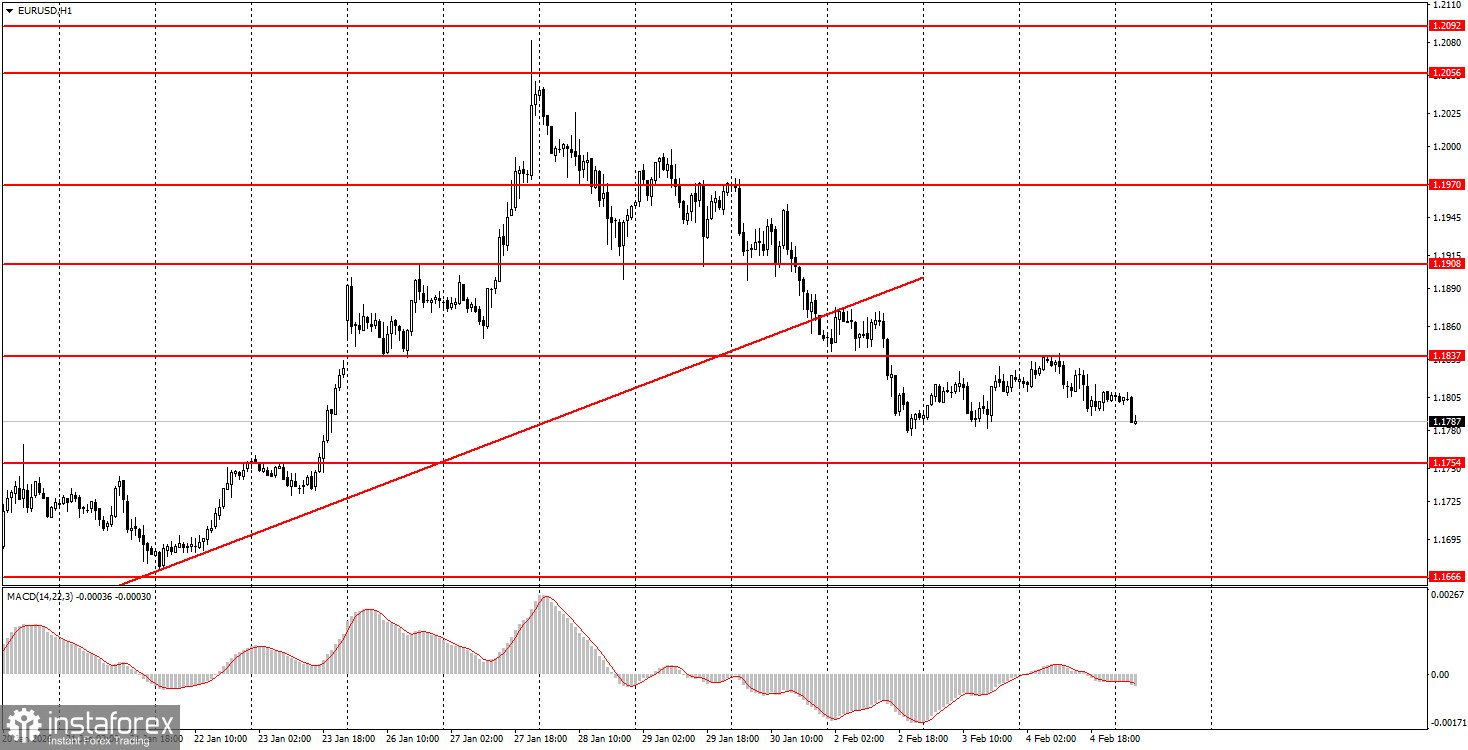
1H Chart of the EUR/USD Pair
The EUR/USD currency pair traded very calmly on Wednesday, despite a rather strong macroeconomic backdrop. However, it is worth starting not with the macroeconomic context, but with the fundamental one. Last night, it became known that negotiations over the nuclear deal between the US and Iran ended before they even began. The parties could not agree on the format or location for the talks. Initially, the US and Iranian delegations were supposed to meet in Istanbul on Friday. Still, Tehran proposed moving the negotiations to Oman and holding a strictly bilateral meeting without representatives from other countries. Washington refused. Thus, the likelihood of an airstrike on Iranian territory sharply increased yesterday. Additionally, yesterday's inflation report from the Eurozone allowed for a decline in the European currency, as inflation slowed to 1.7%, increasing the likelihood of a new cut in the ECB's key rate. Not today, but in the near future. Given the scale of the news, volatility during the day could have been higher.
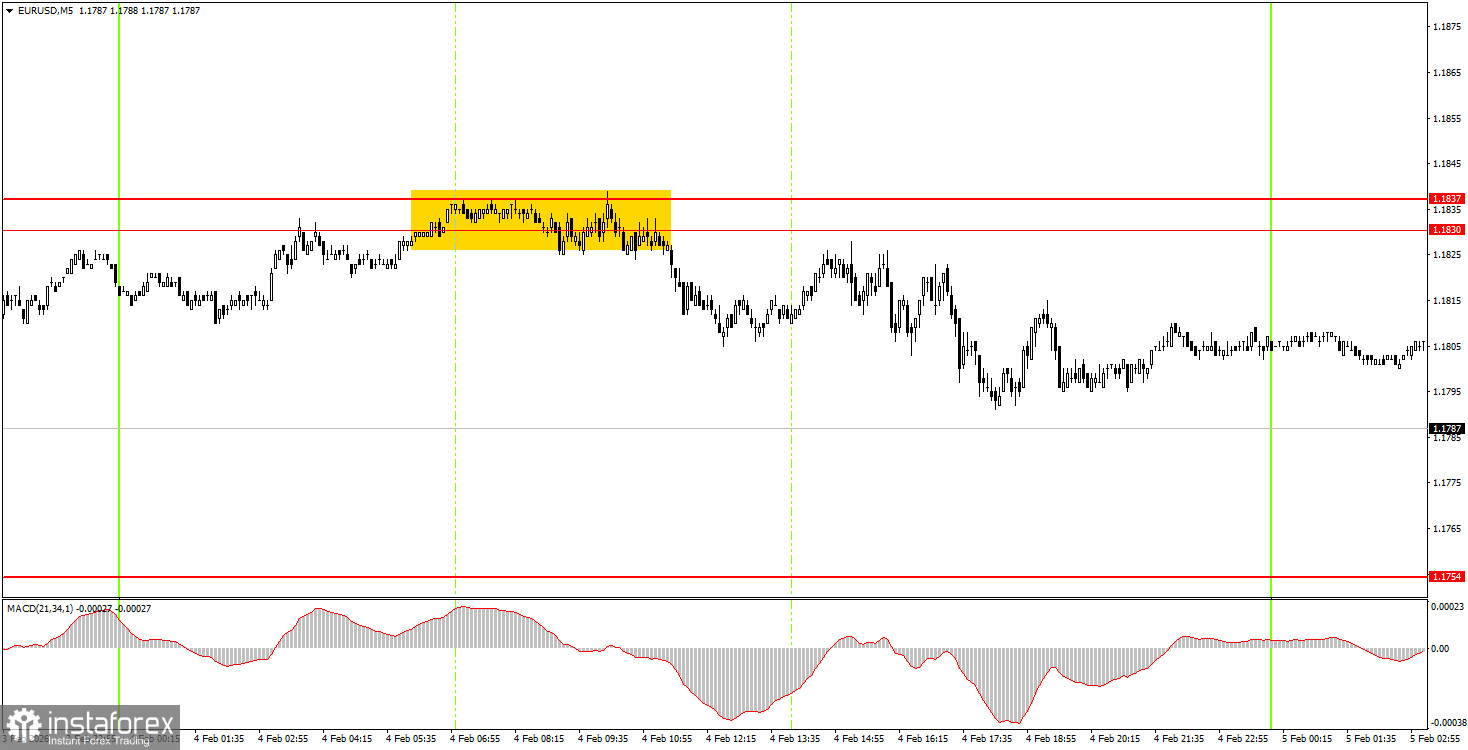
5M Chart of the EUR/USD Pair
On the 5-minute timeframe, there was only one trading signal on Wednesday, but due to low volatility, it was hard to achieve a significant profit from it. During the European trading session, the price rebounded from the 1.1830-1.1837 area, allowing beginner traders to open a relatively straightforward short position. By the end of the day, the price fell around 20-25 pips, which constituted the profit from the trade. The position could also be held open, targeting 1.1754 for Thursday.
How to Trade on Thursday:
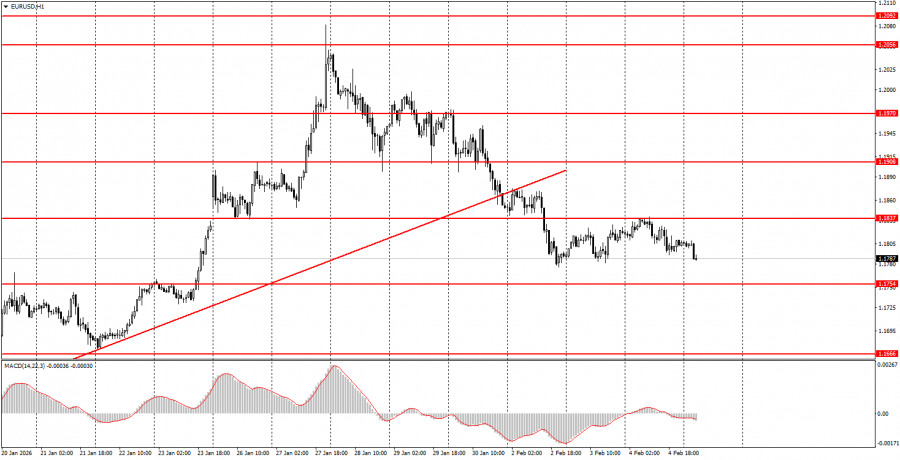
On the hourly timeframe, the downward correction continues. Recall that the flat phase lasting 7 months has been completed. If so, a long-term upward trend has been restored at the beginning of 2026. Therefore, we expect a new medium-term decline for the dollar. The overall fundamental background remains very challenging for the US currency, so we fully support further upward movement for the euro.
On Thursday, beginner traders may consider holding short positions after a rebound from the 1.1830-1.1837 area, targeting 1.1745-1.1754. A price rebound from the area of 1.1745-1.1754 will allow for long positions targeting 1.1830-1.1837.
On the 5-minute timeframe, levels to consider include: 1.1354-1.1363, 1.1413, 1.1455-1.1474, 1.1527-1.1531, 1.1550, 1.1584-1.1591, 1.1655-1.1666, 1.1745-1.1754, 1.1830-1.1837, 1.1908, 1.1970-1.1988, 1.2044-1.2056, 1.2092-1.2104. Today, the Eurozone will announce the results of the ECB meeting. This is an important event on paper, but in reality, the European Central Bank is unlikely to make significant decisions, so the main interest lies in the speech of Christine Lagarde.
Main Rules of the Trading System:
- The strength of the signal is determined by the time it took to form the signal (rebound or breaking through the level). The shorter the time, the stronger the signal.
- If two or more trades were opened around a particular level based on false signals, all subsequent signals from that level should be ignored.
- In a flat market, any pair can generate numerous false signals or no signals at all. In any case, it is best to stop trading at the first signs of a flat.
- Trades are opened during the time period between the start of the European session and until the middle of the American session, after which all trades should be manually closed.
- On the hourly timeframe, signals from the MACD indicator should ideally be traded only when there is good volatility and a trend confirmed by a trend line or channel.
- If two levels are too close to each other (ranging from 5 to 20 pips), they should be considered as a support or resistance area.
- After moving 15 pips in the correct direction, it is advisable to set the Stop Loss to break-even.
What's on the Charts:
- Support and resistance levels are targets for opening buy or sell trades. Take Profit levels can be placed around them.
- Red lines indicate channels or trend lines that reflect the current trend and indicate the preferred direction for trading now.
- The MACD indicator (14,22,3) – the histogram and signal line – serves as a supplementary indicator that can also be used as a source of signals.
- Important speeches and reports (always found in the news calendar) can significantly influence the movement of the currency pair. Therefore, during their release, trading should be conducted with maximum caution, or it is advised to exit the market to avoid a sharp price reversal against the preceding movement.
- Beginners trading in the Forex market should remember that not every trade can be profitable. Developing a clear strategy and practicing sound money management are the keys to long-term trading success.