Analysis of Friday's Trades:
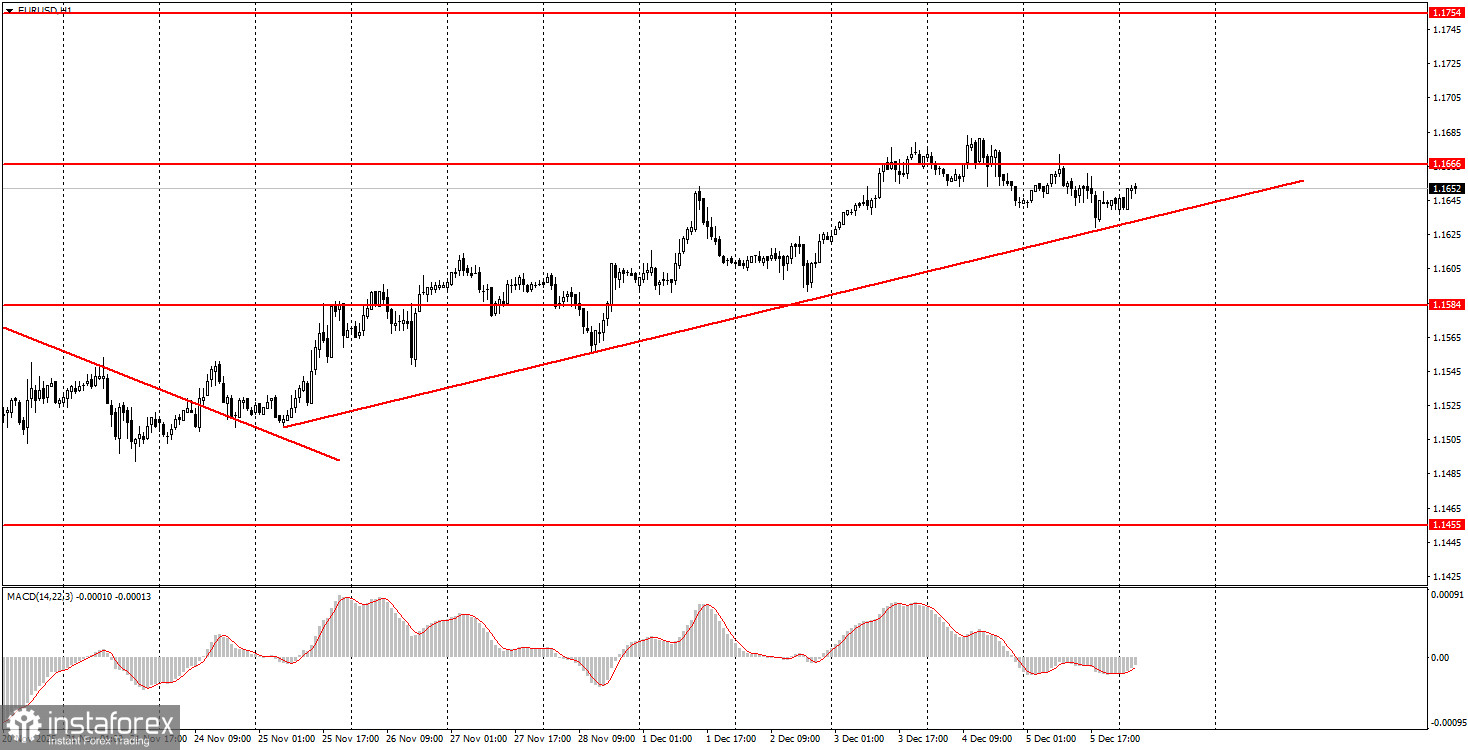
1H Chart of the EUR/USD Pair
The EUR/USD pair traded again on Friday with minimal volatility, not exceeding 40 pips. In principle, we have been discussing weak volatility for several consecutive months, and unfortunately, there is little we can do about it. The market remains in a state of stagnation, and for the sixth consecutive month, a flat trend persists between 1.1400 and 1.1830 on the daily timeframe. Therefore, novice traders can currently only expect weak movements within the sideways channel. On Friday, the macroeconomic backdrop offered some hope of more interesting movement. The Eurozone released the final GDP report for the third quarter, while the US released the PCE index and the University of Michigan Consumer Sentiment Index. However, currently, macroeconomic data (especially secondary ones) have little impact on trading. The consumer sentiment index came in stronger than anticipated, driving the dollar up 20 pips. But who is really interested in a movement of only 20 pips?
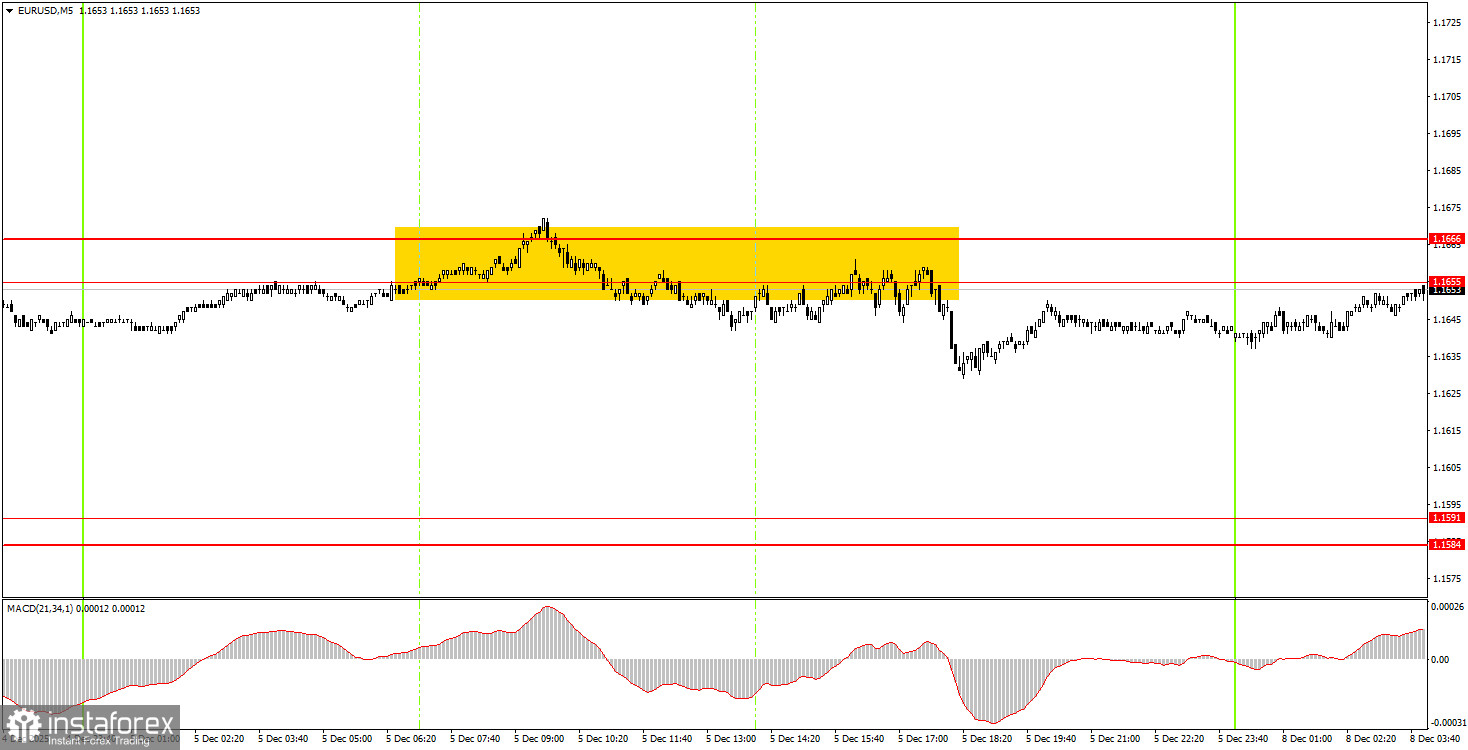
5M Chart of the EUR/USD Pair
On the 5-minute timeframe, it's clear how the pair moved on Friday. The situation was such that the movement following the formation of the signal was weaker than the typical market noise. The price barely "broke away" from the 1.1655-1.1666 range, allowing it to move down about 18 pips. Novice traders could have easily secured that gain, but the wait for the signal to form was long.
How to Trade on Monday:
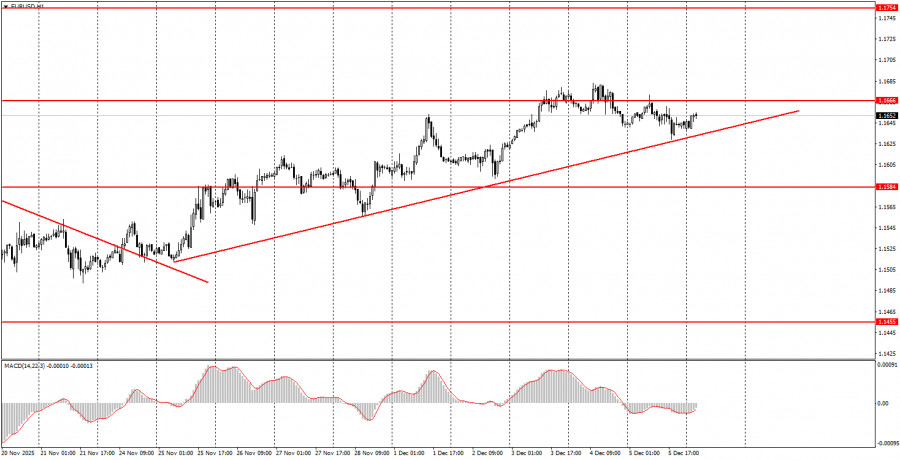
On the hourly timeframe, the EUR/USD pair continues to form an upward trend, as indicated by the trendline. The overall fundamental and macroeconomic backdrop remains very weak for the US dollar, so we expect further growth. Even technical factors currently support the euro, as the flat movement on the daily timeframe persists, and after a reversal around the lower boundary, it is reasonable to expect growth toward the upper boundary.
On Monday, novice traders can again focus on the area of 1.1655-1.1666, as there are simply no other options. A price bounce from this area will allow opening short positions with a target of 1.1584-1.1591. A consolidation above this area will lead to long positions with a target of 1.1745.
On the 5-minute timeframe, levels to consider include: 1.1354-1.1363, 1.1413, 1.1455-1.1474, 1.1527-1.1531, 1.1550, 1.1584-1.1591, 1.1655-1.1666, 1.1745-1.1754, 1.1808, 1.1851, 1.1908, and 1.1970-1.1988. On Monday, only one report is scheduled—the industrial production report from Germany. If the four much more important reports released on Friday provoked a movement of about 30 pips, what can we expect from a secondary report on Monday?
Key Rules of the Trading System:
- The strength of a signal is determined by the time it takes to form the signal (bounce or breakout). The less time required, the stronger the signal.
- If two or more trades were opened near any level based on false signals, all subsequent signals from that level should be ignored.
- In a flat, any pair may form numerous false signals or none at all. At the first signs of a flat, it is better to stop trading.
- Trades are opened during the period between the beginning of the European session and the middle of the American session, after which all trades should be closed manually.
- On the hourly timeframe, it is preferred to trade only when there is good volatility and a trend confirmed by the trend line or channel, using signals from the MACD indicator.
- If two levels are too close to each other (5 to 20 pips), they should be viewed as a support or resistance area.
- Upon moving 15 pips in the right direction, set the Stop Loss to breakeven.
Chart Explanations:
- Support and Resistance Levels: Levels that serve as targets for opening buys or sells. Take Profit levels can be placed near them.
- Red Lines: Channels or trend lines that reflect the current trend and indicate the preferred direction for trading.
- MACD Indicator (14, 22, 3): A histogram and signal line; a supplementary indicator that can also be used as a source of signals.
Important Note: Significant speeches and reports (always included in the news calendar) can greatly influence the movement of the currency pair. Therefore, during their release, it is advisable to trade cautiously or exit the market to avoid sharp reversals against the preceding movement.
Remember: For beginners trading in the Forex market, it is important to understand that not every trade can be profitable. Developing a clear strategy and practicing money management are keys to long-term trading success.