Top.Mail.Ru
empty
06.01.2025 04:48 PM
Analysis for EUR/USD on January 6, 2025

This image is no longer relevant

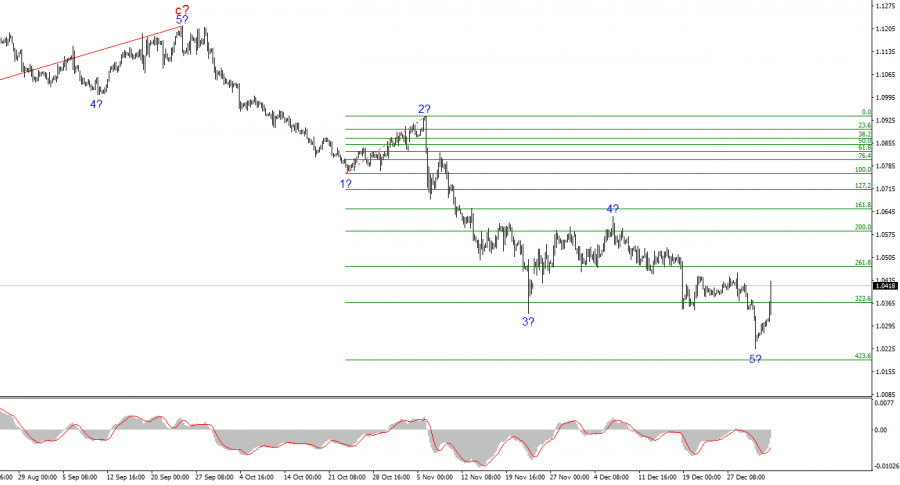
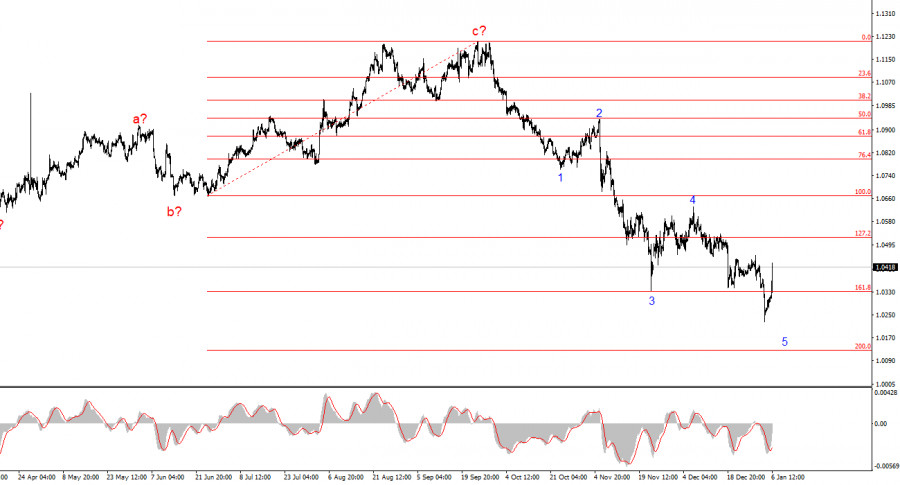
The wave pattern on the 4-hour chart for EUR/USD is becoming increasingly clear. A new downward structure began forming on September 25, which has now developed into an impulsive pattern. The fifth wave, as I anticipated, has taken on a convincing form and could be considered complete at any moment (or might already be completed). This, of course, doesn't mean it must end right now, but any day could mark the end of the current wave structure.

The current wave pattern is straightforward and unambiguous. It's important to note that the news background can influence the market for months but not indefinitely. Reports from the U.S. in recent months indicate that the economy is not facing significant problems. There is no recession, nor is one expected. The economy might slow down, but its current growth rates allow it to navigate this period without significant losses. The Federal Reserve (Fed) is likely to implement monetary easing more slowly and cautiously than markets anticipated at the start of the year. On the other hand, the European Central Bank (ECB) sees no reason to halt its easing efforts and will likely continue. Based on the wave structure, the euro could see growth in the coming weeks, but a new impulsive downward wave is expected afterward.

The EUR/USD pair rose by over 100 basis points on Monday. The news did not suggest such a sharp rise in euro quotes, but the convincing appearance of Wave 5 in the first trend section allows me to assume it has completed. If this is indeed the case, the first wave of the new downtrend section has also concluded. Thus, the construction of a three- or five-wave corrective structure is now expected. This structure doesn't mean that all challenges for the euro are behind. Instead, it signifies a market pause for consolidation, correction, and position distribution. In simple terms, several weeks of pause before resuming euro sales.

Today, the Eurozone released December services PMI indexes. Germany's index was 51.2, slightly above the 51.0 forecast. The Eurozone index was 51.6, compared to a 51.4 forecast. However, I do not believe that a 120-point rise in euro demand over a few hours was driven by these indices. More likely, the first wave of the downtrend ended, leading to a sharp retreat from the recent lows. Additionally, Germany's inflation report showed CPI growth to 2.6%, which might have supported the euro's sharp appreciation.

This image is no longer relevant

Summary

Based on the EUR/USD analysis, the pair continues constructing a downtrend section. This section currently appears well-formed and complete. At this point, I believe the first wave of this trend segment has concluded. Therefore, a three-wave or more complex corrective structure is anticipated, within which new selling opportunities can be identified, targeting levels much lower than the 1.0200 level.

On a higher wave scale, the pattern is evolving into a more complex structure, primarily consisting of corrective waves. A new downward wave sequence is likely, though its length and structure remain uncertain.

Key Principles of My Analysis:

  1. Wave structures must be simple and clear. Complex structures are challenging to trade and often prone to changes.
  2. If there is uncertainty about market developments, it's better to stay out.
  3. There can never be 100% certainty in movement direction. Always use Stop Loss orders.
  4. Wave analysis can be combined with other types of analysis and trading strategies.
Chin Zhao,
InstaForex के विश्लेषणात्मक विशेषज्ञ
© 2007-2025
Summary
Urgency
Analytic
Alexander Dneprovskiy
Start trade
Earn on cryptocurrency rate changes with InstaForex
Download MetaTrader 4 and open your first trade
  • Grand Choice
    Contest by
    InstaForex
    InstaForex always strives to help you
    fulfill your biggest dreams.
    कॉन्टेस्ट में हिस्सा लें

अनुशंसित लेख

GBP/USD, AUD/USD, USD/CHF, EUR/JPY, AUD/JPY, और USD डॉलर सूचकांक के लिए सरलीकृत तरंग विश्लेषण का उपयोग करते हुए साप्ताहिक पूर्वानुमान - 21 जुलाई

GBP/USD विश्लेषण: ब्रिटिश पाउंड में गिरावट जारी है, जो एक महीने पहले शुरू हुई थी। पिछले हफ़्ते एक मज़बूत मध्यवर्ती समर्थन स्तर को तोड़ने के बाद, इस जोड़ी ने वापसी

Isabel Clark 15:21 2025-07-21 UTC+2

EUR/USD, USD/JPY, GBP/JPY, USD/CAD, NZD/USD, और GOLD के लिए सरलीकृत तरंग विश्लेषण का उपयोग करते हुए साप्ताहिक पूर्वानुमान - 21 जुलाई

EUR/USD विश्लेषण: इस साल फरवरी में शुरू हुई मुख्य यूरो जोड़ी में ऊपर की ओर रुझान ने भावों को साप्ताहिक समय-सीमा पर एक व्यापक संभावित उलटाव क्षेत्र की निचली सीमा

Isabel Clark 15:21 2025-07-21 UTC+2

14 जुलाई तक EUR/USD, USD/JPY, GBP/JPY, USD/CAD, NZD/USD, और सोने के लिए सरलीकृत तरंग विश्लेषण का उपयोग करते हुए साप्ताहिक पूर्वानुमान

आगामी सप्ताह में कीमतों में एकतरफ़ा उतार-चढ़ाव जारी रहने की उम्मीद है। शुरुआती दिनों में समर्थन क्षेत्र की ओर नीचे की ओर बढ़ने की संभावना ज़्यादा है, जिसके बाद संभावित

Isabel Clark 19:19 2025-07-14 UTC+2

30 जून तक EUR/USD, USD/JPY, GBP/JPY, USD/CAD, NZD/USD, और GOLD के लिए सरलीकृत तरंग विश्लेषण पर आधारित साप्ताहिक पूर्वानुमान

आने वाले दिनों में यूरो के एकतरफा सपाट चरण में रहने की उम्मीद है। परिकलित प्रतिरोध क्षेत्र के पास, ठहराव और उलटफेर की स्थिति बनने की उच्च संभावना है। सप्ताह

Isabel Clark 18:33 2025-06-30 UTC+2

EUR/USD, USD/JPY, GBP/JPY, USD/CAD, NZD/USD, और GOLD के लिए सरलीकृत तरंग विश्लेषण पर आधारित साप्ताहिक पूर्वानुमान – 19 जून

आगामी सप्ताह यूरो के लिए स्थिर रहने की उम्मीद है। सप्ताह के मध्य तक प्रतिरोध क्षेत्र से उलटफेर और नीचे की ओर गति की उम्मीद है। अनुमानित समर्थन क्षेत्र सुधार

Isabel Clark 20:10 2025-06-19 UTC+2

20 मई, 2025 को GBP/USD का विश्लेषण

GBP/USD के लिए वेव पैटर्न डोनाल्ड ट्रम्प के कारण एक बुलिश इम्पल्सिव वेव स्ट्रक्चर के बनने का संकेत देता रहा है। यह वेव पिक्चर लगभग EUR/USD जोड़ी जैसा ही है।

Chin Zhao 13:36 2025-05-21 UTC+2

EUR/USD, USD/JPY, GBP/JPY, USD/CAD, NZD/USD और गोल्ड के लिए सरल वेव विश्लेषण पर आधारित साप्ताहिक पूर्वानुमान – 21 अप्रैल

EUR/USD विश्लेषण: फरवरी से, EUR/USD एक ऊपर की ओर वेव बना रहा है, जिसकी अंतिम अवस्था (C) वर्तमान में चल रही है। हाल ही में इस जोड़ी ने एक मजबूत

Isabel Clark 11:13 2025-04-21 UTC+2

EUR/USD, USD/JPY, GBP/JPY, USD/CAD, #Bitcoin, और #Ripple के लिए सरलीकृत तरंग विश्लेषण पर आधारित साप्ताहिक पूर्वानुमान - 31 मार्च

आने वाले दिनों में यूरो विनिमय दर में गिरावट का दौर पूरा होने की संभावना है, जो संभावित रूप से गणना किए गए समर्थन क्षेत्र की निचली सीमा तक पहुंच

Isabel Clark 19:17 2025-03-31 UTC+2

20 मार्च 2025 को EUR/USD का विश्लेषण

EUR/USD के 4-घंटे चार्ट पर वेव संरचना एक अधिक जटिल रूप में बदलने के जोखिम में है। 25 सितंबर को एक नया डाउनट्रेंड संरचना बननी शुरू हुई, जो एक इम्पल्स

Chin Zhao 08:05 2025-03-21 UTC+2

10 मार्च को EUR/USD, USD/JPY, GBP/JPY, USD/CAD, GOLD और बिटकॉइन के लिए सरलीकृत तरंग विश्लेषण पर आधारित साप्ताहिक पूर्वानुमान

विश्लेषण: फरवरी की शुरुआत से ही, यूरो एक ऊपर की ओर टेढ़ी-मेढ़ी लहर बना रहा है, जो एक नए तेजी के रुझान की शुरुआत को दर्शाता है। यह जोड़ी साप्ताहिक

Isabel Clark 10:15 2025-03-10 UTC+2
अभी बात नहीं कर सकते?
अपना प्रश्न पूछें बातचीत.
Widget callback
 

Dear visitor,

Your IP address shows that you are currently located in the USA. If you are a resident of the United States, you are prohibited from using the services of InstaFintech Group including online trading, online transfers, deposit/withdrawal of funds, etc.

If you think you are seeing this message by mistake and your location is not the US, kindly proceed to the website. Otherwise, you must leave the website in order to comply with government restrictions.

Why does your IP address show your location as the USA?

  • - you are using a VPN provided by a hosting company based in the United States;
  • - your IP does not have proper WHOIS records;
  • - an error occurred in the WHOIS geolocation database.

Please confirm whether you are a US resident or not by clicking the relevant button below. If you choose the wrong option, being a US resident, you will not be able to open an account with InstaForex anyway.

We are sorry for any inconvenience caused by this message.